Under the Hood of Gojek’s Automated Forecasting Tool
Deconstructing GO-FORECAST, our automated tool for reliable forecasts taking into account exogenous variables.


By Lawrence Wong
Forecasting is a ubiquitous problem at Gojek . Almost every team depends on it to make critical decisions such as resource allocation. Despite its importance, the quality of our predictions largely hinge on the availability of relevant data and the forecaster’s understanding of the topic. The former is typically not a problem at Gojek — unless we are forecasting for a new product.
The latter is where we see huge room for improvement.
In this post, we explain GO-FORECAST, Gojek’s first democratised and automated machine learning tool that solves a huge portion of our forecasting problems.
The Birth of a Solution
Most people typically employ Google Sheets or Excel for completing the task. If they have access to a Data Analyst or Scientist then they would probably end up with Auto Regressive Integrated Moving Average (ARIMA) or Exponential Smoothing (ETS). While these popular solutions do often work well, most of them are unable to incorporate exogenous variables in the model.
This means we cannot account for the ever-shifting Ramadhan seasonality periods, spending information, or any other important variables we could think of in our models.
Fortunately, one of our analysts won first place in a national Data Science competition in late 2018. We took inspiration from his winning approach and abstracted the process.
The result is GO-FORECAST, which was born in June 2019:
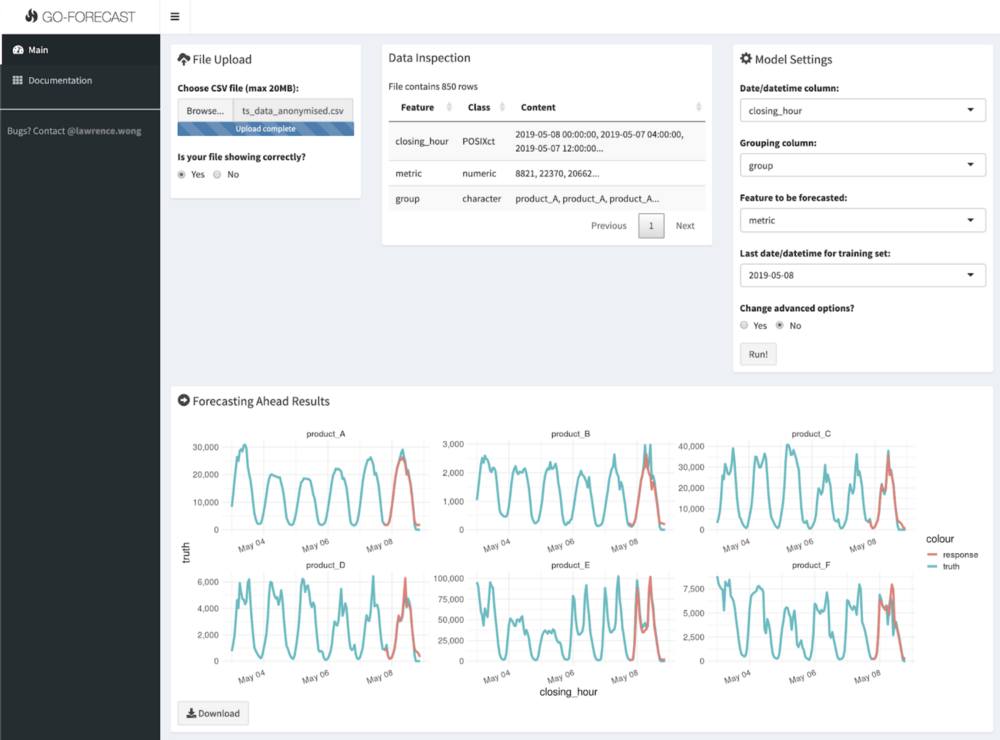
We call GO-FORECAST ‘democratised’ because everyone in Gojek can access the tool. It performs the entire ML pipeline of tuning, training, and predicting in just a few clicks. We use the powerful XGBoost algorithm as the main engine.
To show you how this solution fares against the aforementioned incumbents, we did an extensive benchmarking exercise using hundreds of real Gojek daily datasets. The contenders include:
- ARIMA
- ETS
- Multiple linear regression (MLR) with holiday information (is_holiday column)
- MLR without is_holiday column
- XGBoost with is_holiday column
- XGBoost without is_holiday column
Because MLR and XGBoost are able to take in external features, we threw in various calendar signatures (day of week, year, month, and so on) and lagging values of the target variable into the models. We also specifically chose the forecast period which contains more holidays than usual and created versions with/without the holiday information. The hypothesis is that the is_holiday column will significantly boost the performance of the models in aggregate.
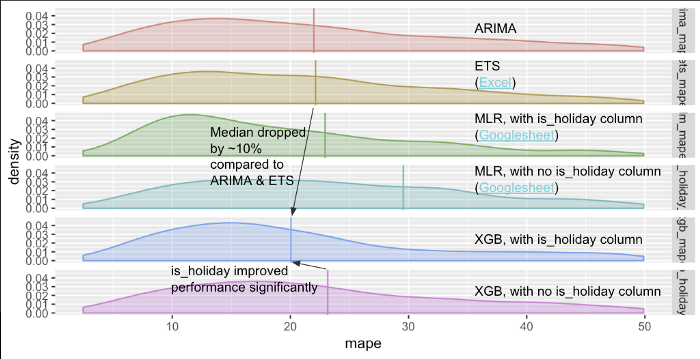
In total, thousands of models were made (several hundred for each contender). The results are summarised in the chart below:
In this image:
X-axis = mean absolute percentage error (MAPE), the lower the better. The x-axis has been clipped at 50% MAPE due to extreme skewness.
Y-axis = the density or relative number of models at a given point of MAPE. Vertical line = the median MAPE.
XGBoost with holiday information outperforms the other contenders.
Directly comparing the distributions proves to be challenging due to outliers — we had models with MAPE of tens of thousands of percent (😱)! So we clipped the chart at 50% MAPE to highlight the main points and added the medians to serve as the proxy of overall performance.
First of all, XGBoost with is_holiday column outperforms the rest with ~10% lower MAPE on average (median) than the 2nd and 3rd best (ARIMA and ETS, respectively). Second of all, if we removed the holiday information then the XGBoost performance degrades a bit but was still competitive to ARIMA and ETS. More interestingly, the typical MLR with holiday info was only about as good as the typical XGB without!
No wonder the forecasting competitions in Kaggle are dominated by XGBoost and its cousins!
Under the hood
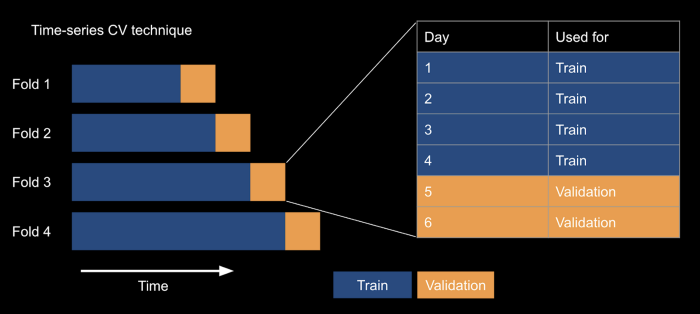
A key technique that we would like to highlight is the cross-validation methodology we used to tune the models.
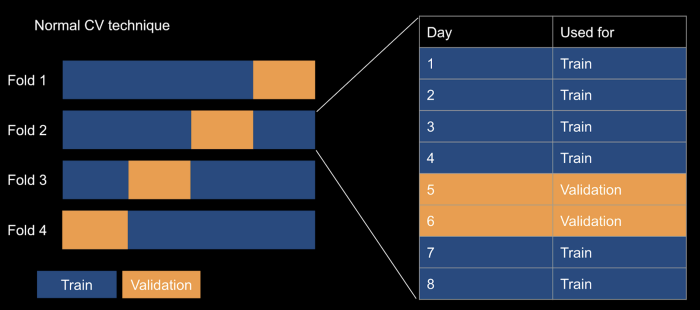
We use time-series cross-validation (TS CV), which, unlike normal CV schemes, respects the time structure. TS CV does this by keeping the validation sets at the end of the folds and growing the window with each subsequent fold. This prevents us from predicting the past using future data, which is impossible to do in real life — it’s silly trying to predict next week using next month’s data. 🤷🏻♂️
On the other hand, normal CV scheme randomises without regard to the time structure and peeks into the future before making the prediction. This will almost guarantee to overfit the model.
Other features
Besides the superiority of the performance and the ease of use, this first version also comes with several other features:
- Can create many related models at once. For example, users who want to forecast for multiple cities just need to click ‘Run’ one time
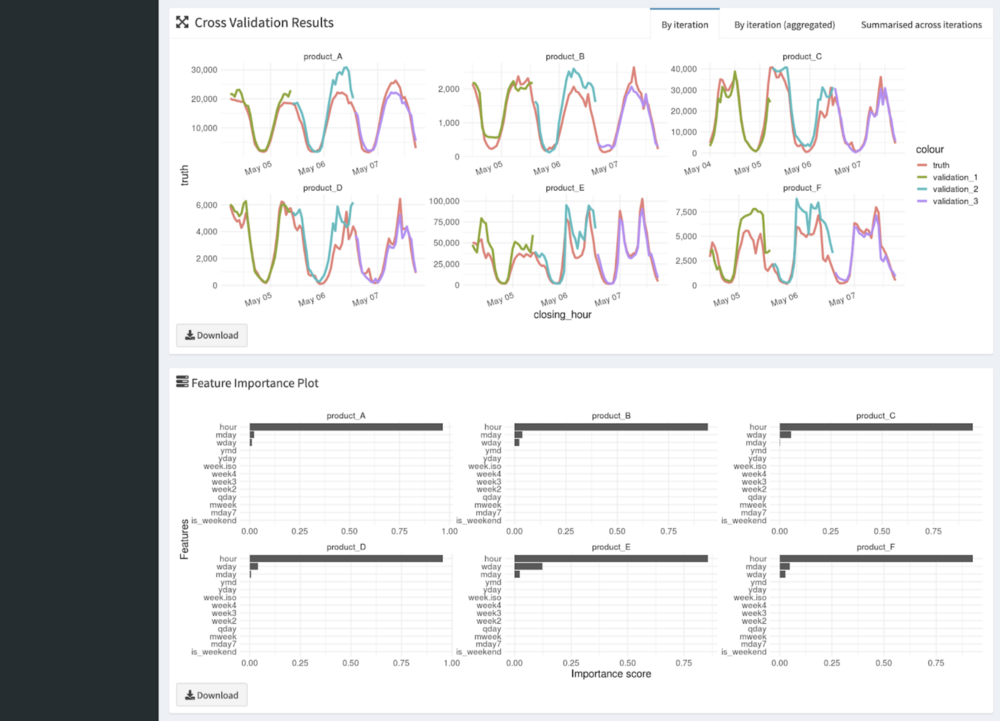
- Can rank features based on importance. This is important to understand the business levers and how much a variable affects the target
- Can estimate model performance for non-existent future data. The tool will display the TS CV results for users to understand the uncertainty of the forecasts
- Can predict various future scenarios. For example, users can find out what will happen to the number of transactions when we reduce/increase spending
What next?
We are just getting started. In the immediate future version, we will be solving for XGBoost’s limited ability to extrapolate. In more distant releases we are planning to add model stacking, aggregation and scenario building capabilities.
Stay tuned!
P.S. Did I mention Gojek’s Growth team is hiring analysts? We are a data-driven bunch who helped shape some of Gojek’s best practices through projects like this one. Want to join us? Check out gojek.jobs. 🙌
Oh, and for more stories like this delivered straight to your inbox, sign up for our newsletter!