Trial by fire and ice: Simulating 160,000+ requests per minute
After failing more times than we can imagine, Load Testing becomes critical. Here’s a reckoner on how we do Load Testing at GO-JEK

By Tilak Lodha
At GO-JEK, we’ve had our fair share of downtimes. We’ve failed more times than we can imagine as demand for our products have increased manifold. Every time we re-wrote our core systems, demand has spiked. In 20 days, we went from 20,000 to 80,000 drivers. These were early days when we actually raised the price of our services to slash demand. Today, we’ve learnt fast from these failures and are still learning.
In that context, Load Testing is critical for a hyper-growth startup like GO-JEK. Imagine you create a new endpoint for your service and it works just fine locally. Next, you test it on different environment, commonly termed as “integration”, and it works fine there too. Is that sufficient enough to ensure it will run perfectly when it goes live?
Maybe. Maybe not. And you certainly can’t leave things to chance when you have a customer base of millions.
This is when load-testing comes in handy. You try to create an environment similar to actual traffic by generating fake requests. This can be either normal traffic or anticipated peak traffic.
Implementing Load Testing
Let me give you some context about the kind of work we’re doing. For our car driver app, GO-CAR, we have a feature called “heatmap”. This gives our car drivers an idea where to move to get more bookings at better prices. Recently, we added the same features to our bike driver app, GO-RIDE, but it had to be tested thoroughly before releasing it.
Problems when testing the load in GO-RIDE:
- Number of bike drivers online are at least 4x more than car drivers. So traffic here is enormous. Any mistake is going to impact a huge base. (At the time I wrote the article, we were at 4x. Before publishing this, we’re at 5x. So you can only imagine the scale and rapidity of growth)
- Your local machine doesn’t have enough computing power. (More on this later)
- You don’t know the breaking point of the production boxes which are running live. It’s difficult to conclude what amendments you have to do in an architecture when you can’t gauge the tipping point.

How do we do it?
In the past hour alone we’ve had more than 60k car drivers checking maps to determine their exact location on our servers. That essentially means they’re checking our heatmap feature, sometimes even at 30k requests per minute. The number of bike drivers are at least 4x than those of cars. So if you make this assumption, you have to handle 120k requests for bike heatmaps.
So in total/minute: 120K (request for bike heatmap) + 30K (request for car heatmap) +10K (other request on the service) = 160K
In our production, we have 4 Virtual Machines (VMs), each of type quad core to handle all the load. But in integration, we have 1 VM and that is a single core. So we need to make around 10k request per minute on our single core VM in integration. For load testing, we use Vegeta (HTTP load testing tool) to generate requests at constant rates for a particular duration.
vegeta attack -rate=150 -duration=120s -targets=targets.txt > results.bin
This command makes 9K requests per minute on our service. All the requests are kept in “targets.txt” file and prints results in “results.bin” file.
cat results.bin | vegeta report -reporter=text > result.txt
Next, this command will generate the output in result.txt, which will look like this:
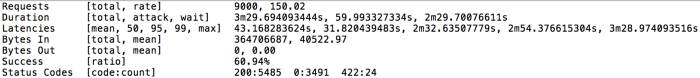
The only unusual thing: the duration showed here is 3m29s. That was the second blocker we faced; not enough computing power. Through our local machine, a huge number of requests can’t be served (3491 in this case, error being “Too many open files”).
To solve this, we used 5 different clusters with a much lesser rate running parallel so all our requests are served. Through Vegeta, you can also make requests in a distributed manner. The results we got from this were far better and looked like this:
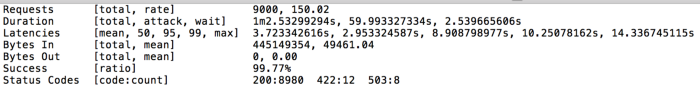
These are the combined results from all the 5 different boxes and the results are lot better. Even the latencies are way better.
Now you have assurances that the VM with one core can handle the requests, but you still want to know the breaking point. If you check the results, you have some 503s, which means the server is about to reach its maximum limit . So if we increase the rate at which requests are hit we arrive at the breaking point. For our use case, that limit was around serving 12k RPM.
Getting back to our usual problem to serve 160k RPM, we needed new VMs. Else, we would have a lot of 5xxsand it will affect other services. So based on our load testing results, we estimated that we need 4 VMs. But just to be on the safe side we set up 6 new VMs. We haven’t encountered a problem since.Failed fast, grew fast, learnt fast.
Now we have 1,000,000 drivers and the secret to our sauce is good code, lots of testing and good software development practices. Any recommendations? Please leave a comment below.
We’re hiring! Please check out gojek.jobs for more.