Statistical Testing at Gojek
How GoStat — Gojek’s internal self-serve tool — helps experimenters run appropriate statistical tests and reduce false positives.


By Lawrence Wong
You’ve just received the result of an experiment you started 2 weeks ago. It said your treatment group was 7% higher than your control group. “Nice,” you mumble to yourself.
But how certain are you that this 7% increment was legit? If you scale this up, will you get a similar uplift? After all, you could have gotten a false positive by some stroke of bad luck.
These are some of the most commonly-asked questions by experimenters anywhere. Let’s see how we can use the p-value to answer them. Later on, we will also introduce the in-house tool we’ve built to do this automatically.
P-Value and Null Hypothesis
Any college-level statistical textbook would define p-value as the probability of obtaining results as extreme or more extreme than the actual observations, if the null hypothesis is true. In that mouthful, the null hypothesis is the most confusing jargon, but it’s important to firmly grasp its meaning to understand p-value.
Put simply, the null hypothesis supposes that nothing is happening. That is, your groups are all equal to each other, even after treating them differently. Understanding this is key to visualising p-value, which we attempt to do below.
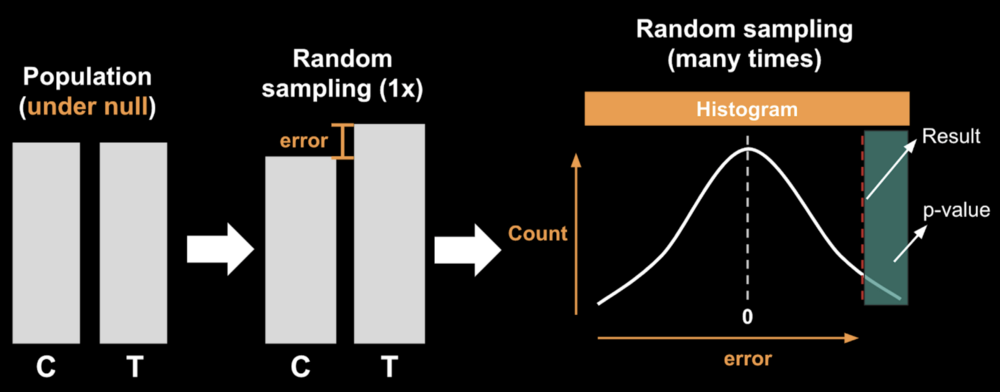
Under the null hypothesis, your control group (C) and treatment group (T) will have come from identical populations. However, by random sampling, we would introduce some error. This causes the sampled groups to not be exactly equal anymore. If we repeat this sampling process thousands of times and record the difference every time, we could construct a histogram of the errors. As you can see from the normally-distributed histogram, if the groups have come from identical populations, it would be very unlikely for the errors to stray far away from zero.
Now suppose our experimental results is the red dashed line. Using the histogram, we can compute the size of the green box area, which signifies how often the errors of the magnitude of our results (or more extreme than that) would appear.
This is the p-value.
The further away from zero our observed results are, the smaller the p-value would be. This is in line with our intuition that more extreme results should have a lower probability of being a false positive.
Therefore, if the p-value is sufficiently small, you could conclude that the difference was likely to be legit, given everything else (design of experiment, execution) being correct.
Note that in this case, we are only computing in one direction. In reality, we normally consider p-values from both sides to suggest the possibility of the results going in either way.
The good news is, you don’t have to perform any manual random samplings or area calculation to get the p-value. Statistical tests can generate them for you.
Getting it Right
The bad news is, there are many different types of statistical tests out there that can all produce p-values. And you need to know which one to use since different situations could call for different statistical tests. Many of them are not interchangeable, and there is no almighty test that can cover all scenarios. Choose poorly and you will get garbage p-values, which could lead to wrong decisions being made. If someone tells you to ‘just t-test it!’ without even knowing the details of your data, you can safely walk away and ask someone else who hopefully knows better.

At Gojek, we’ve developed a self-serve tool called GoStat that can automatically select the most appropriate statistical test for your situation. It does this by first analysing your experimental data. If the selected test requires certain assumptions to be met, GoStat will check those assumptions first and can intelligently choose a less stringent test if the assumptions were not satisfied.
Things to Note
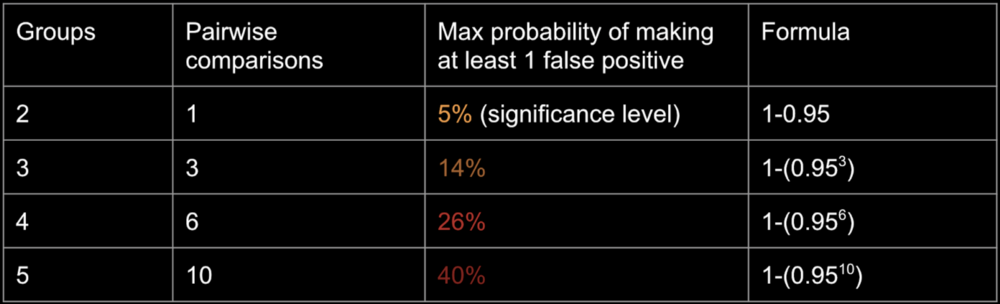
Another aspect of statistical testing to be wary of is the growing false-positive rates when performing many tests, if not accompanied by proper defensive measures. In real life, this materialises when you have many groups in a single experiment. As the table below showed, with 2 groups and 5% p-value threshold, the maximum probability of making at least 1 false-positive is restricted to 5% (source). As you increase the number of groups — and therefore the number of pairwise comparisons — the maximum probability of making at least 1 false-positive skyrocketed. With just 5 groups, it ballooned to 40% if uncontrolled!
To combat this, we’ve incorporated additional protective layers in GoStat’s algorithm. It runs a broader omnibus test that encompasses all the groups in a single test, and also performs adjustments to make the pairwise p-value more conservative.
Ever since the initial version was released in December 2018, GoStat has been used by many experimenters at Gojek to easily and correctly analyse experimental results. Previously, different teams would use different statistical tests for similar types of experiments. While some were correct, others were not. By standardising our approaches to doing statistical tests, GoStat reduces the number of wrong decisions being made due to wrong tests selected or inflated false positives.
