Reducing Our Build Time By 50%
How we reduced the build time by 50% by tweaking Xcode build settings on Gojek's iOS app.

By Sanju Naik
Gojek’s iOS consumer app is a multi-repo setup with 40+ git submodules. We are a team of around 100 iOS Engineers pushing hundreds of commits every day to ship features to the Gojek Super App. To give you a sneak peek into our CI stats, on a busy day we run around 300–350 CI Pipelines. 🔥
We use the “God workspace” model for development, i.e., all the modules are added as subprojects to one single Xcode workspace. This large setup poses its own set of challenges and the build times are one of the topmost concerns. To keep up with the fast-paced dev environment, improving build time was the need of the hour for us.
To give you an idea about the problem, our 95th percentile incremental build time was ~11 mins 📈, which is quite high. This was affecting developer productivity and also not a good developer experience.
We used XCLogparser to analyze Xcode build logs, unearthed the hidden information there, corrected misconfigurations, and also changed the way we load Cocoapods. All of this helped us achieve a massive 50% reduction in build time 🎉 🎊 . Our incremental build time was reduced from 11 mins to 5 mins.
The below graph shows the amazing results we achieved:

It’s amazing how just tweaking the Xcode build settings helped us achieve such a massive reduction of 50%. Let’s dive into the details to understand more, well before that, a little bit of background about the problem.
Our project structure
We have a Multi-repo setup with 40+ git submodules. The project repository structure looks something like this:

Consumer app’s main repository has Xcode workspace which includes all of the module’s Xcode projects as subprojects.
At Gojek we are a developer experience team focused on solving build and infrastructure-related problems to provide the best possible experience for our developers and improve their productivity.
Here are the statistics around what was our incremental build time before.
What was our incremental build time before? 🤔
Before starting this project, our 95th percentile incremental build time was ~11 mins. The below trendline shows our incremental build time over a period of time.

Since our incremental build time was considerably high, reducing it became our priority. Also, developers spend most of their time building the app incrementally hence any improvements we make to incremental build time have a direct impact on the developer productivity and the experience.
Better developer experience would mean that developers can ship features faster and this, in turn, makes the business stay ahead of the competition.
How did we approach the problem?
To analyze the problem better we needed to collect the data from developer machines, such as targets built part of a build, time-taken by each target, cache utilization, etc. We used XCLogparser for this.
XCLogparser is an open-source CLI tool by Spotify which parses xcactivitylog file (A log file created by the xcodebuild system per build and stored in DerivedData, which has all the information related to the particular build) and gives a detailed build report in json or html format.
Data collection using XCLogParser
We added XCLogparser in Xcode’s post-build script. Xcode triggers this action as soon as the build completes. So we were able to parse build data using XCLogParser and push it to our in-house dashboarding system.
The below image shows Xcode’s post_build actions script.
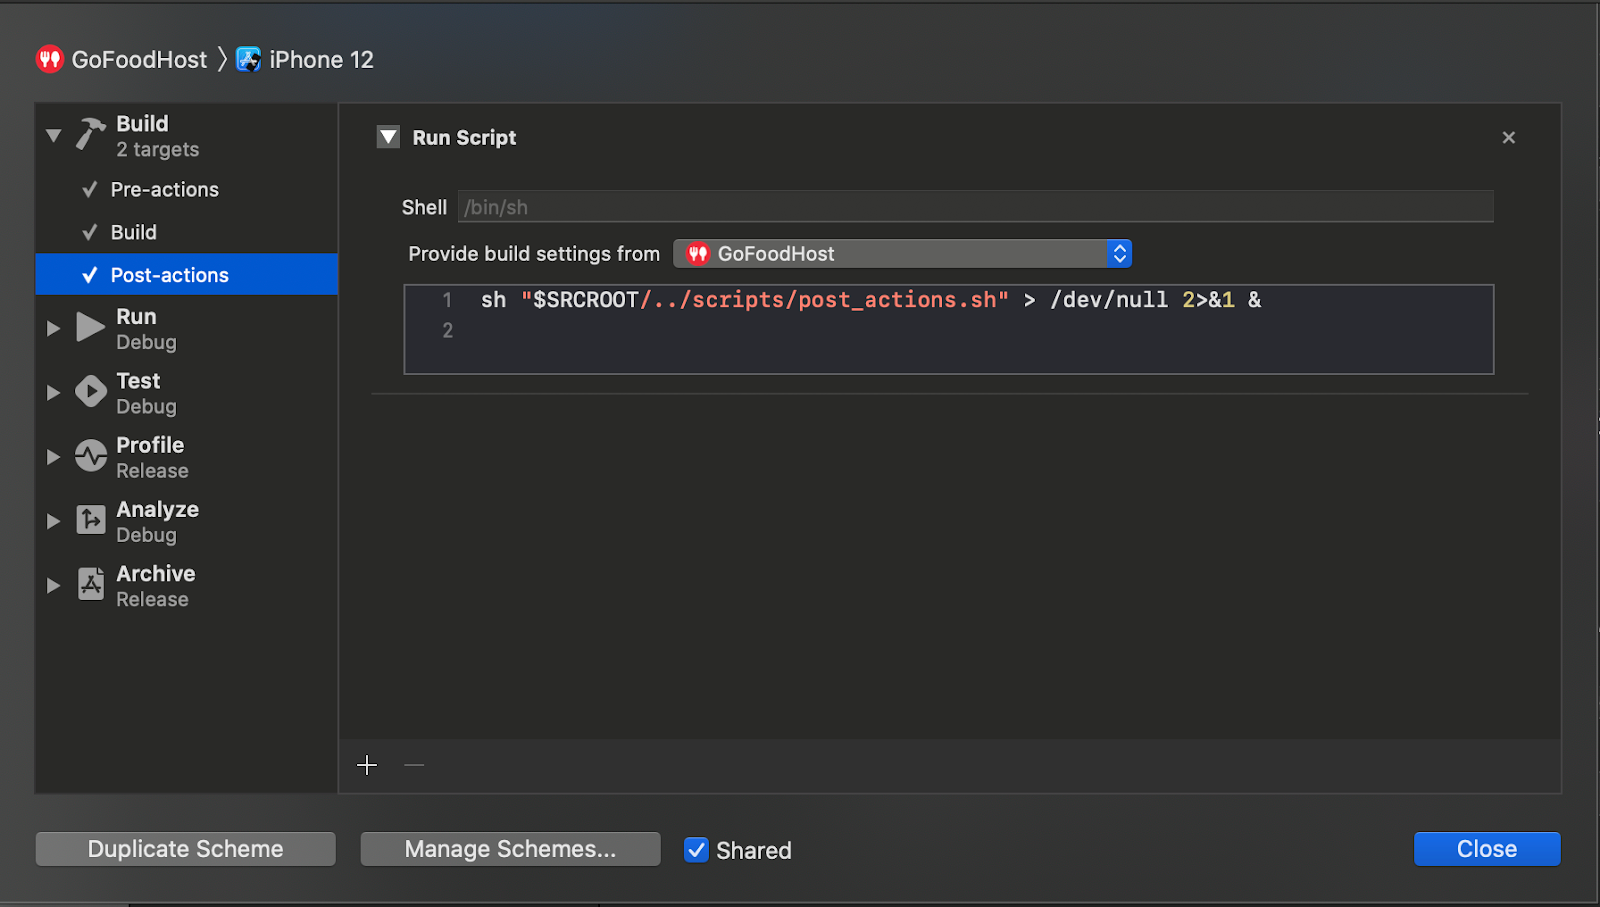
The post_actions.sh script internally uses XCLogParser, & at the end of the script makes sure the script executes in the background and doesn’t add any extra overhead on the build times.
Here are some of the visualizations we built out of the data we collected.

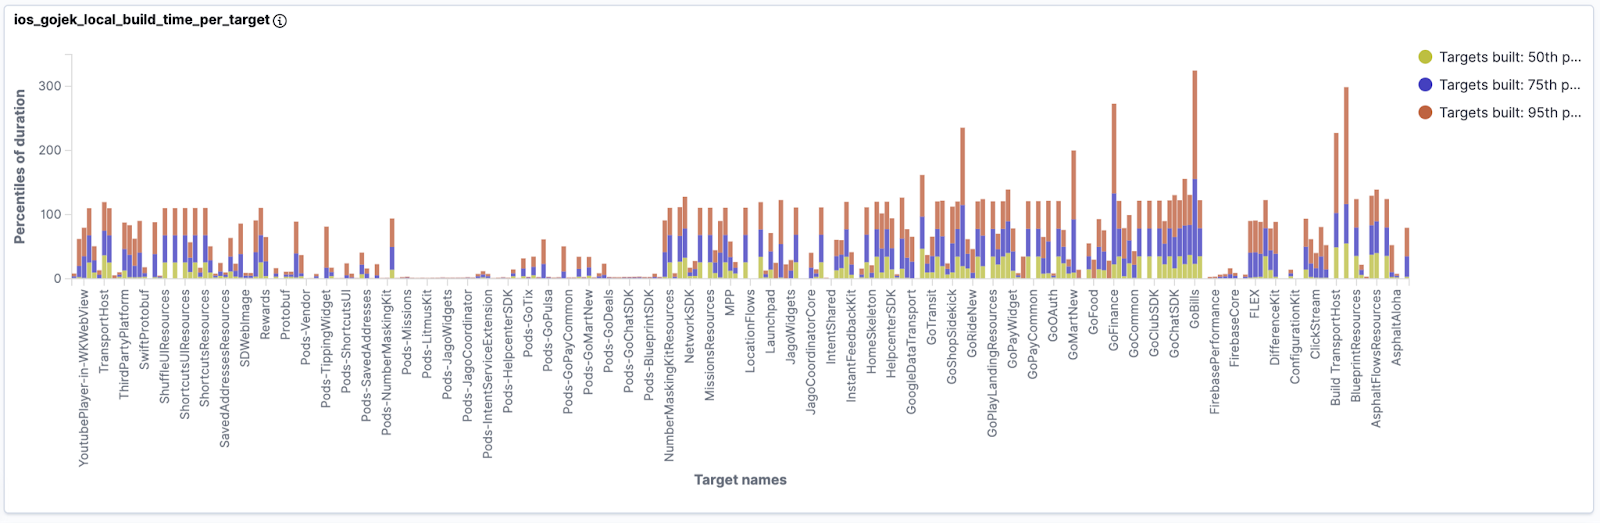

Dashboards were good, and gave us good insights about build time metrics, but they only gave us a bird’s-eye view of the problem. To understand finer details we needed something else.
When we were thinking about the alternatives, one of the ideas was that we can just directly talk to the developer the moment the build happens. Talking at that immediate moment was crucial because later developers might not remember what exactly they did.
The idea seemed good but how do we do this? We are a team of around 100 engineers, doing this manually would have been a nightmare, that’s when we built a slack workflow to automate this process.
Slack workflow for micro feedback collection
Since we were already measuring build times using XCLogparser, so whenever an incremental build took >3 mins, we pushed that data to our internal Slack channel using a Slack bot.
Our Slack workflow looked something like this :

And here is the screenshot of the message contents.
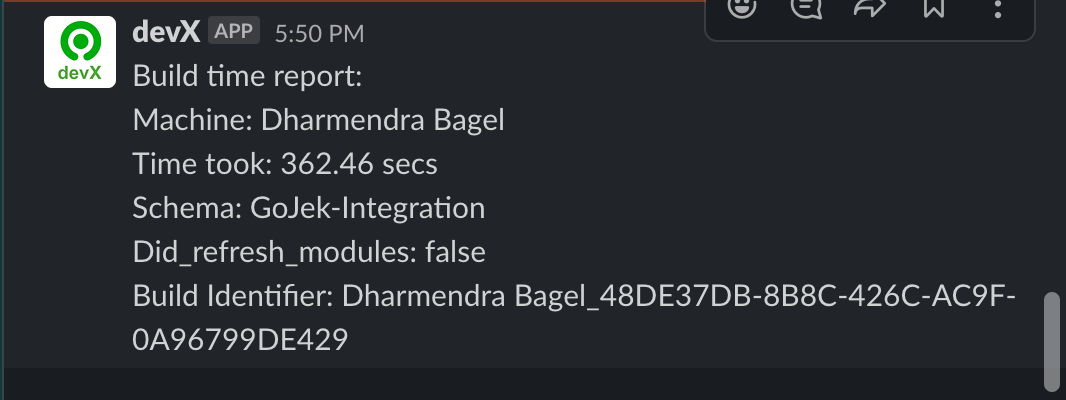
That’s it 💥 🍾. The slack build time reports helped us to quickly talk to developers and also investigate build reports on our dashboards. This was the major breakthrough!
Even though this was not a long-term solution, we had to do this to understand the ground reality. As a Developer Experience Engineer, it’s important to be a developer first and to empathize with a developer. This meant we march in tandem with the developers and know their pain in and out. And the results were surprising. The micro feedback established the connection between the build engineers and developers, we were able to capture developer sentiments and understand how exactly they work and their pain points.
How did we debug build-related problems?
As we analyzed build logs and tried reproducing the build scenarios, we felt we need to know more to decipher the mysterious Xcode build logs. Compiler performance document by Apple has good information on how the compilation process works and some tools and tricks to debug build-related problems.
From the above document we mainly used “-driver-show-incremental” and “-driver-time-compilation” flags. These flags need to be added to “other swift flags” build settings as shown in the below image:

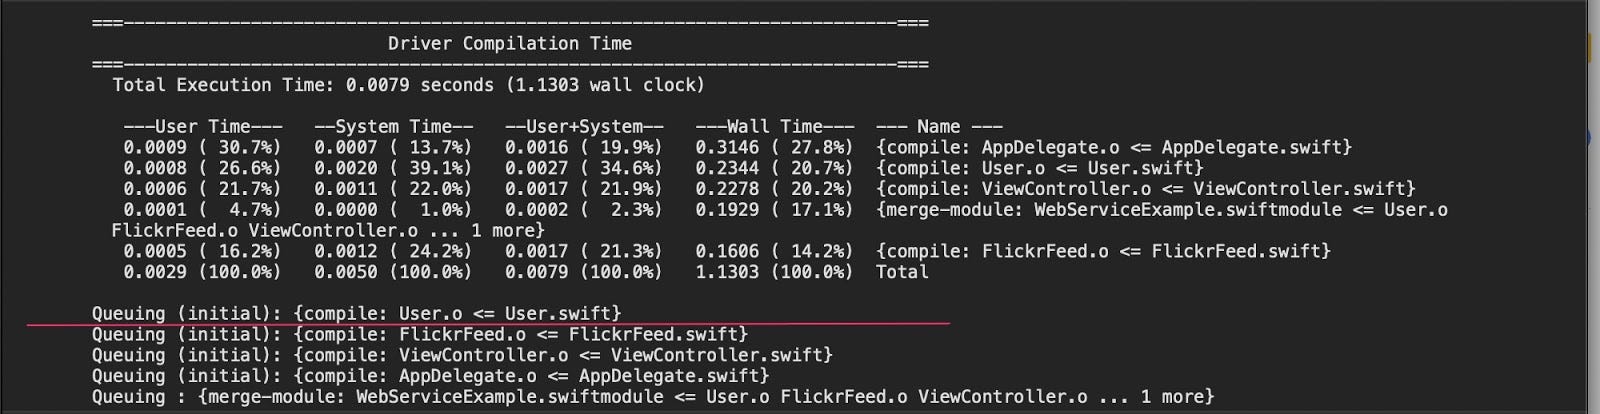
Once the above flags are added, we need to build the application and look for the “Compile swift sources” step in the build logs of a module. The logs would show the reason why that particular module is built.
Build system output after adding the above flags would look like this:

Along with this, we used a few tricks from the below gist, by Daniel Dunbar, Apple Build systems Engineer.
From the above gist we enabled “defaults write com.apple.dt.XCBuild EnableDebugActivityLogs -bool YES” and “defaults write com.apple.dt.XCBuild EnableBuildDebugging -bool YES”.
When the above flags are enabled, they create build.trace file at “DerivedData/<project>/Build/Intermediates.noindex/XCBuildData/buildDebugging-xxxx.yyy”. The trace file will have a list of rules created by the build system and tasks created to execute them. The contents of the trace file would look like this :

How to Interpret Build Trace File
This is how we interpret the above trace file: Build system created rule-R4 to build target WebServiceExample and in the next steps it checks whether this rule(R4) needs to be executed or not. Then in the next line, it says the “rule-needs-to-run” and the reason is “never-built”. This means the module was never built or artifacts don’t exist in the cache (DerivedData).
In the next step, we can see that the build system creates a new task-T4 to run the rule R4. Likewise, we can search for the target we are debugging and for the reason, it's being built.
Note: All the Above flags should be enabled only while debugging, If we leave those enabled it will slow down the build.
We extensively used the above two debugging techniques and XCLogparser to debug build-related problems.
Identified build problems and Solutions :
1. Recursive `FRAMEWORK_SEARCH_PATHS` problem :
The very first problem we identified was, every time we did a clean build, we were doing two clean builds instead of one. i.e Our first build after the clean build (first incremental build) also took an equal amount of time as the clean build.
When we looked at the logs of the 2nd build, we noticed that most of the modules were getting recompiled even though they were compiled in the 1st build and there was no code change. We analyzed why modules were getting recompiled using our learnings and the results were surprising.
How did we debug this problem :
When we looked at the build.trace file located at “DerivedData/<project>/Build/Intermediates.noindex/XCBuildData/buildDebugging-xxxx.yyy” to figure out why most of the modules were getting recompiled in the 2nd build. We noticed that one of the core modules was marked as changed in the 2nd build, which was causing a rebuild of all its downstream dependencies.
To further analyze why the core module was marked as changed, we compared its xcodeproj build settings with other modules and noticed that one of the entries in “FRAMEWORK_SEARCH_PATHS” was set to ‘recursive’, because of this, instead of reusing artifacts from DerivedData it was getting rebuilt. Since it’s one of the core modules which other modules depend on, so all of its dependent modules were also getting re-built, resulting in a complete rebuilding of the app.
Solution :
The solution was to change the FRAMEWORK_SEARCH_PATHS to `non-recursive`. After this change build system was able to reuse artifacts from cache and dependencies weren’t getting compiled in the 2nd build. With this change, we saved ~15 minutes for our developers every time they did a clean build.
Takeaway :
It’s always recommended to set FRAMEWORK_SEARCH_PATHS to non-recursive to avoid such build-related problems.
2. Inconsistent build settings across sub-projects problem
The second problem we identified was, almost our entire app was getting rebuilt when we switched between schemes.
Developers can choose to build a particular module’s scheme or the entire Gojek app from the scheme selector menu as shown in the below image
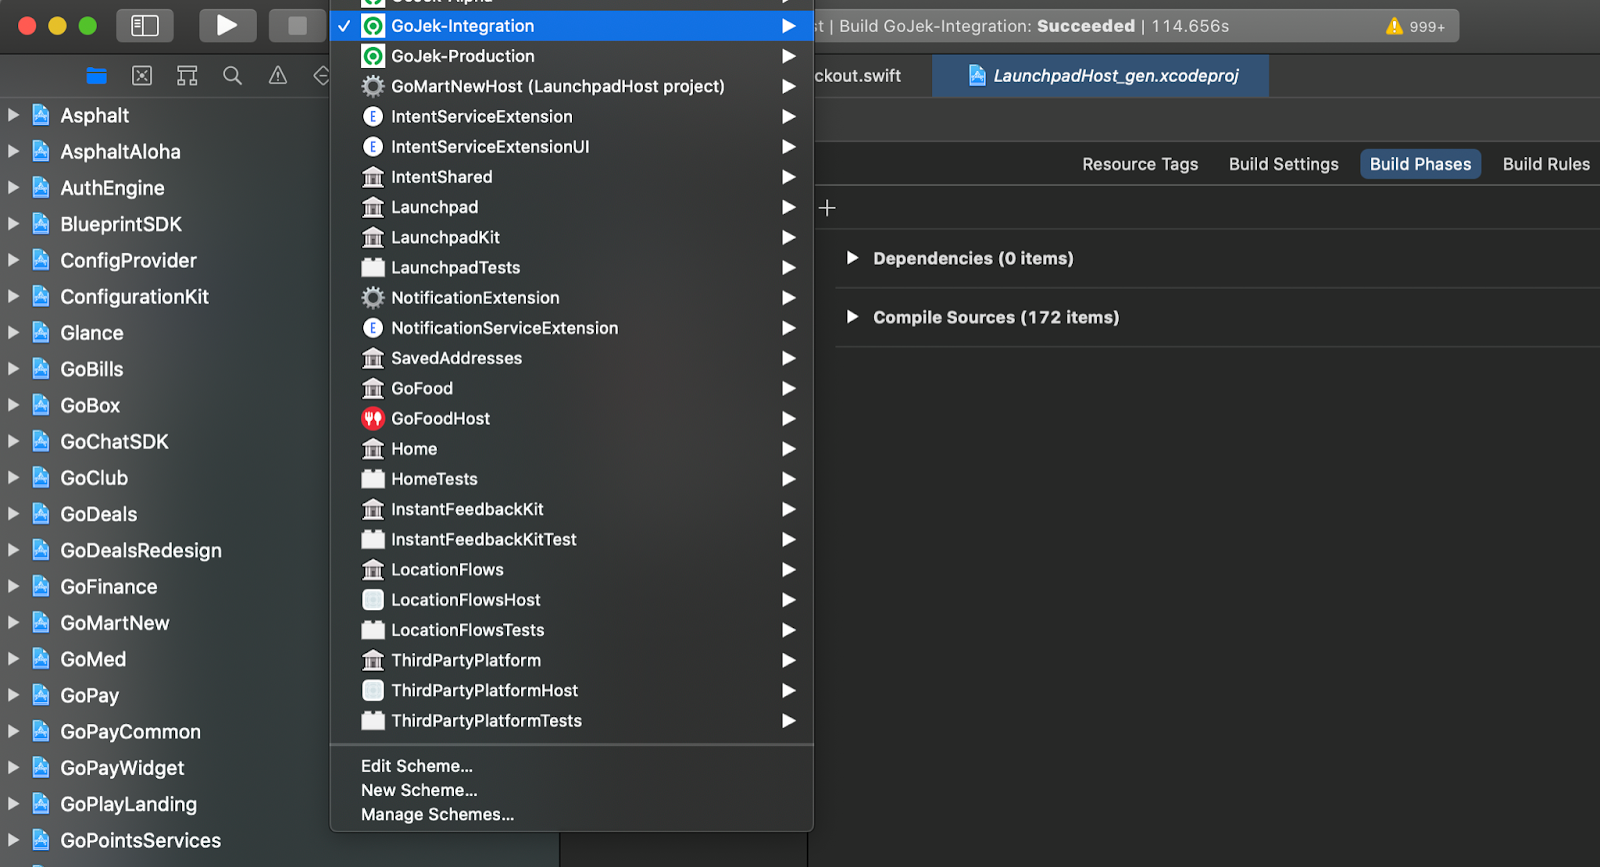
Ex: When developers built the main app Gojek-Integration and switched to building another scheme say Launchpad, all the dependencies of the Launchpad module were getting rebuilt instead of being utilized from the cache.
How did we debug this problem :
We picked up a module (let’s refer to it as ModuleY ) for analysis. We wanted to see, does this module has the same compiler inputs when it's being built as part of both builds (Gojek & Launchpad schemes). As different compiler inputs can trigger a rebuild.
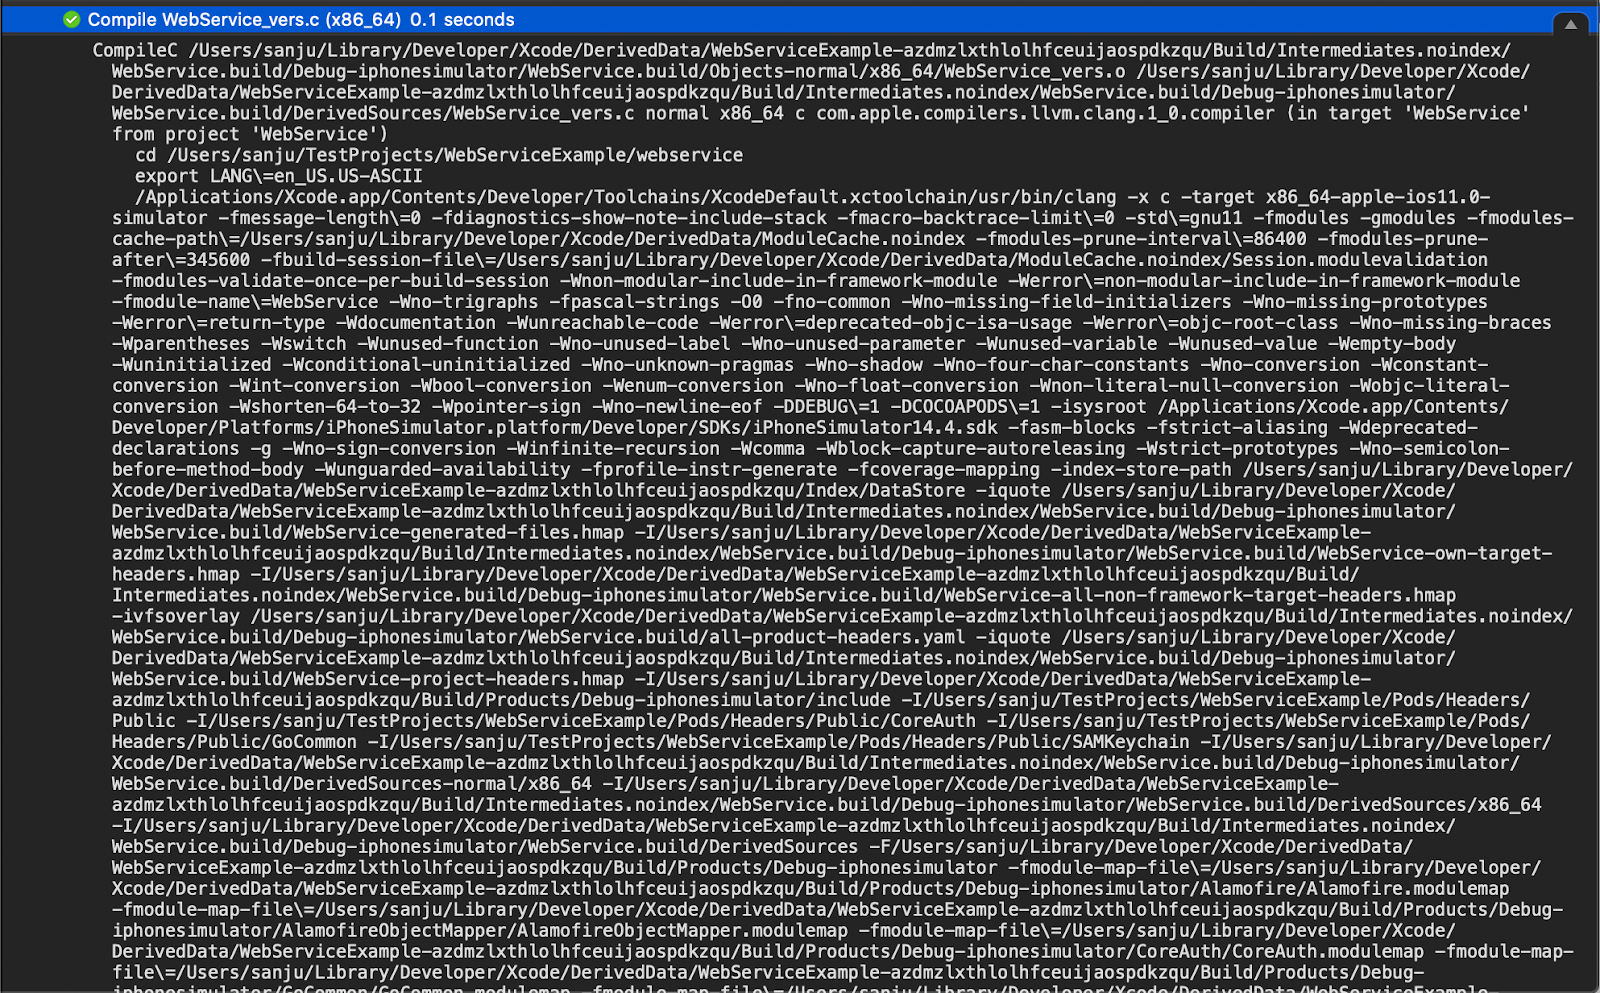
When we looked at the compiler inputs, the Swift files compilation step wasn’t of much help because swift files had the same compiler inputs for both the builds. So when we were looking for a different file type, we found that every Xcode target has a C file called “ModuleName_vers.c”, so we used this file for comparison.
The below image show’s the compilation step of WebService_vers.c, we can see the inputs passed to the compiler.
When we compared compiler inputs of `ModuleName_vers.c` file, we noticed that 2 extra flags were passed when the Gojek scheme was built. Here is the screenshot of the comparison :
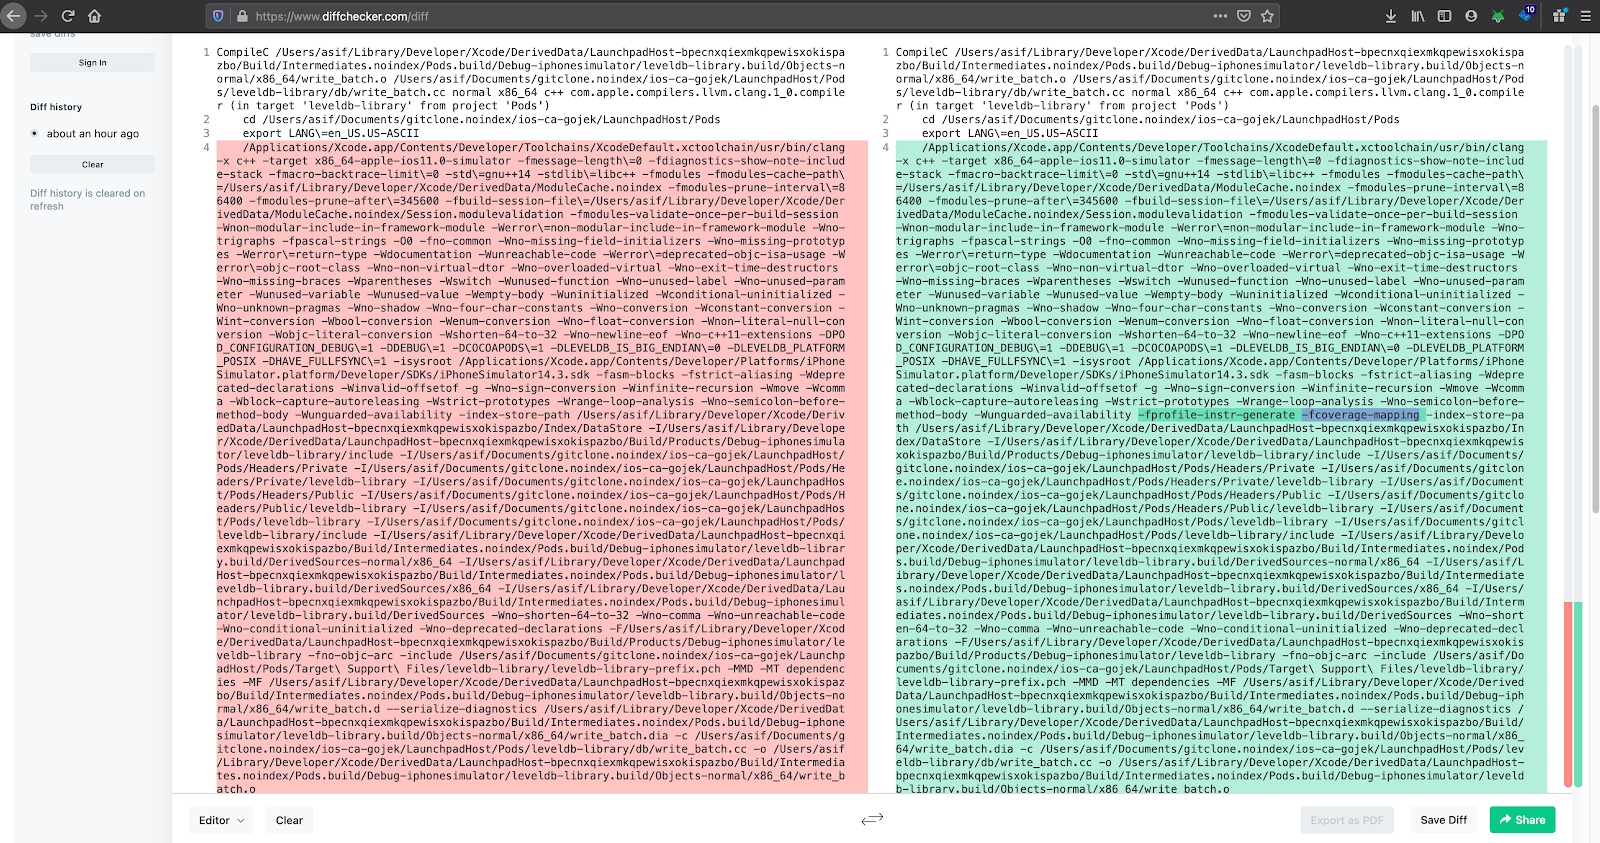
The “-fprofile-instr-generate” and “-fcoverage-mapping” were the extra flags being passed. By looking at the flags we thought, this might be something related to code coverage and then when we verified the 2 schemes (Gojek-Integration and the Launchpad), we found out that the Launchpad scheme didn’t had the “gather coverage for” option enabled. As shown in the below image.

So when we enabled the “gather coverage for” option for Launchpad, compiler inputs for both the builds were the same and dependencies weren’t getting re-built. With this change, switching between schemes just took 2 mins, compared to 13 mins earlier. i.e 80% improvement 🚀 💥.
Takeaway
It’s Imperative to have the same build settings across Xcode projects when they are part of the same workspace.
3. Complete recompilation of the app, when developers switch between simulators
The third problem we identified was, our entire app was getting recompiled when developers switched between simulators. This problem was more concerning than the first 2 because It's quite common for developers to verify their changes on at least 2 simulators when they are working on UI-related features. And every time they switched simulators, they had to wait 15 mins for the app to launch😞.
How did we debug this problem :
We tried switching between simulators and analyzed build logs to figure out why this is happening, every time we switched between simulators we noticed that our in-house modules were getting rebuilt with the reason - “because of external dependencies”.
Using the dependency graph we tried looking at what are those external dependencies, when we traced the dependency tree we figured out that the external dependencies were 3rd party cocoapods libraries. From this, it was evident that for some reason cocoapods were causing the rebuilding of all of its downstream dependencies and that resulted in the almost complete rebuilding of the app.
When we analyzed which task or step is getting executed in cocoapods, traversing through rules and tasks in the build.trace file, we noticed that cocoapods had a run script to copy generated header files and module map files to `BUILT_PRODUCTS_DIR` and this script was getting executed every time we switched between simulators.
Since the run script was modifying `BUILT_PRODUCTS_DIR` i.e the output directory of the pod in DerivedData, hence the build system marked that pod as modified, which was causing rebuilding of all of its downstream dependencies.
A little bit of information about the run script :
Cocoapods have a run script to copy the generated header files and the module map file to `BUILT_PRODUCTS_DIR`. More Information on module map and generated headers files can be found here https://clang.llvm.org/docs/Modules.html#module-map-file .
The Below image shows the run script:
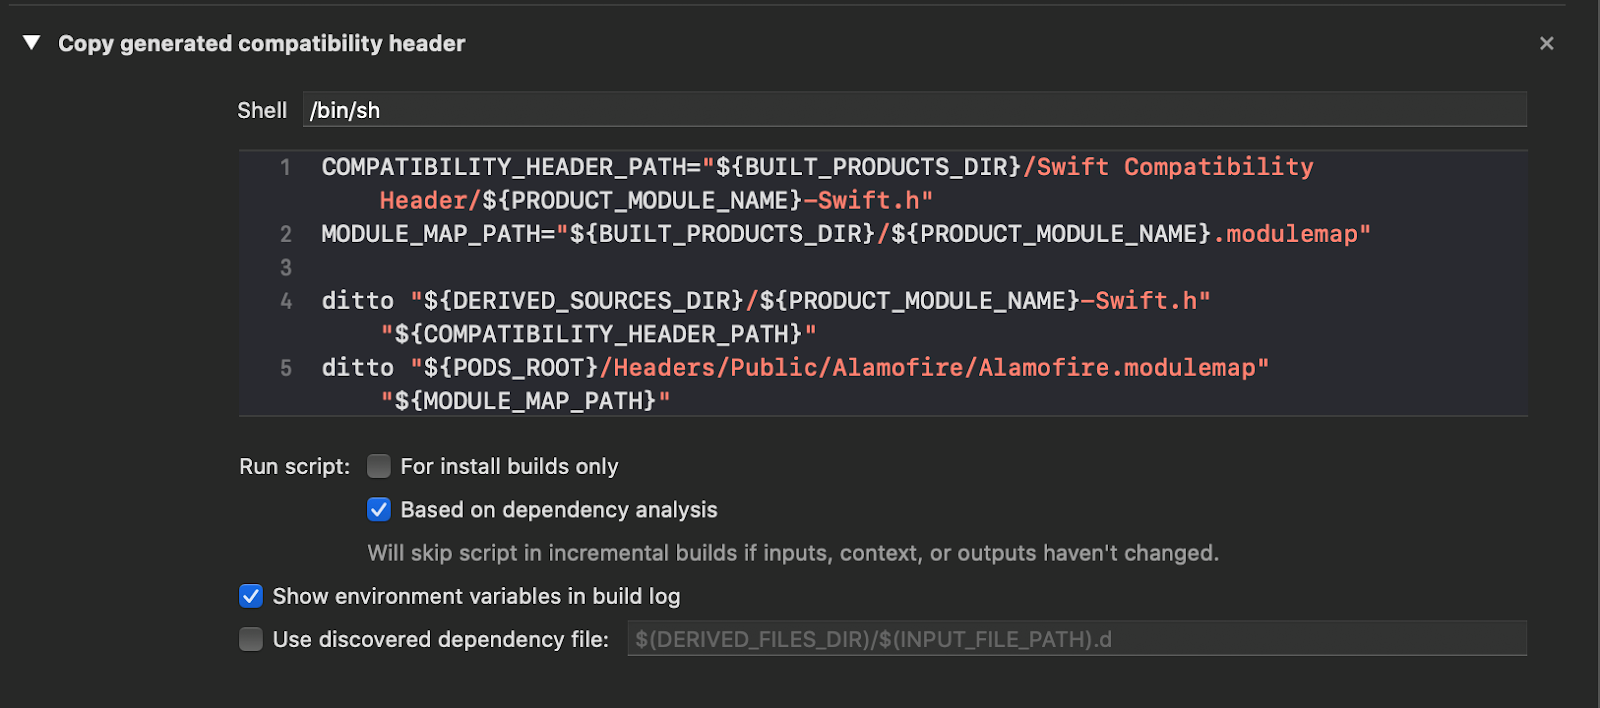
Cocoapods adds this run script only when pods are added as static libraries. We have around 70+ cocoapods added as static libraries, adding them as dynamic frameworks wasn’t an option because that would affect our app launch time.
Solution
Adding cocoapods as dynamic frameworks was not an option as that would affect our app launch time. We found out that Cocoapods provide a way to load pods as static frameworks as well, which is sort of the best of both worlds. The linkage is still static but the pods are added as frameworks so they don’t need a run script to copy module map and generated header files to built products directory.
To add cocoapods as static libraries we need to add this line to Podfile - “use_frameworks! :linkage => :static” . This worked like a magic with this change switching between simulators just took 2 mins compared to the earlier 15 mins (i.e 85% reduction).
What was the result?
As we solved the above 3 problems, we saw a massive reduction in 95th percentile incremental build time. Build time was reduced from 11 mins to 5 mins, i.e more than 50% reduction. Also, this change helped us save around 60 hours of developer time per week.
The below graphs show the build time improvements we made:


This was a huge win for us and was appreciated by everyone across the organization.
What Did we learn
- What works for others may not work for you, It’s hard to generalize a problem. So it’s important to pay attention to the problem and understand it in detail. Collect enough data to prove your hypothesis. Do brainstorming sessions and only when you are convinced that something works and it’s backed by data then go for the execution.
- Working on the build time-related stuff is quite different than building an iOS app. There is little to no documentation and also the StackOverflow will not be of much help. So you have to try out things, do trial & error methods, mostly a hit, and miss approach but it’s worth it.
- After this exercise we now have a way better understanding of the Xcode build system than we did before, we learnt about the compilation process and how the build system works under the hood so now we are confident enough to debug build-related problems and can reason about build times.
Conclusion and future plan
We managed to reduce our build time by 50% from where we were, but we aren’t stopping here, our end goal is to have 95th percentile incremental builds under 1 minute. To get build times under 1 minute we have a few things in our pipeline, Spiking out on the Bazel build system is one among them.
Thank you for reading this blog, do watch out, this space for our future blogs, we will keep sharing our learnings.

Check out more stories from the vault here.
Oh, and we’re hiring: