Reducing Build Time For Gojek #SuperApp
How we strived to improve build time in our app to help increase developer productivity.

By Shailesh Sengar
Gojek Android consumer app is a mono repo and has 210+ Gradle modules. The incremental build takes less than 2 minutes (which is still quite high) to build the app.
Gojek has 100+ android engineers working on various facets of the consumer app whose average commit is around 20 per day. There are days where commits go up as high as 50+. 🤯
So, it’s imperative to keep the build as fast as possible for better developer productivity.
The problem of high build time
Developers took time to iterate product features because the feedback loop kept increasing as the number of modules in the app increased. This lead to:
- Bad developer experience
- Large iteration time
- Less productivity
The devX (Developer Experience) team, started working on improving build times and managed to decrease incremental build time by 70% on an app with 210+ Gradle modules.
Developers could now utilise this time for product feature development or finish their tech debt.

How we optimised build times
Increased build time was becoming a problem that needed to be looked into on priority and brought down.
But how do we reduce the build time?
Where do we start?
All these questions lingered in our minds when we started out.

Tools for studying build times
To optimise build times, we needed to know what was causing it in the first place. The tools that helped us are:
Talaiot
Talaiot is a Gradle plugin that records the duration of Gradle tasks, helps understand problems of the build and detects bottlenecks.
We use Talaiot to get fine-grained details on each build such as
- What task was run? (E.g.:
./gradlew assembleDebug) - How much time did each task take to complete?
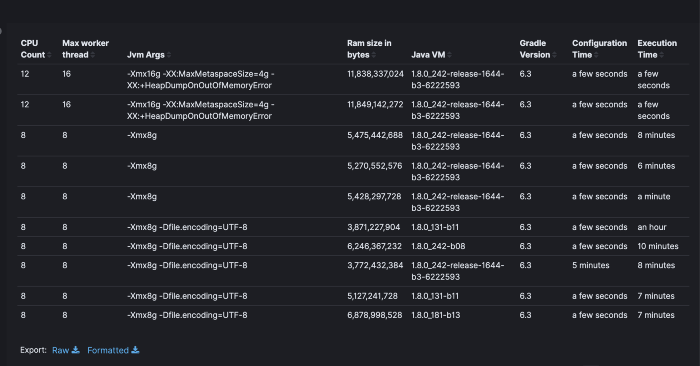
- What is the machine configuration on which the task was executed? (Max Worker threads, CPU configuration, RAM Configuration, Gradle version, Java VM Version)
Gradle Build Scan
Gradle Build Scan is a Gradle plugin that gives all build information like Gradle execution phases, network utilisation, cache information, etc. Using Build Scan, we could dig deeper into Gradle tasks and fix the caching issues. Gradle Scan has helped a lot to find all required information at a single place like configuration time, execution time, no. of threads used, network time, cache miss reason, etc.
Gradle Profiler
This is a tool to automate the gathering of profiling and benchmarking information for Gradle builds. We used Build Scan as a profiling tool.
Now that we have the tools to measure various parameters of the build, the next step is to select parameters to optimise upon. So what do we measure?
Measuring build time
To get a holistic view of build times across developer machines we broadly measured 3 categories of build parameters
- Gradle parameters: This gives an idea of what’s happening in Gradle. We measure:
- Build configuration time
- The execution time of each task
2. System Environment parameters: This gives an idea of the environment on which the Gradle build is happening. The parameters we measure are
- CPU configuration
- RAM configuration
- JAVA VM version
- Max worker threads
- JVM Args
All the above parameters have an impact on the speed of builds, and we wanted to study the correlation between system configurations and build times. This can help us to get better laptops for devs.
3. Cache parameters: Gradle has a robust caching mechanism. The hit/miss ratio is an important parameter that determines the speed of incremental builds. Measuring the hit/miss ratio gives us an idea of misconfigured tasks (Cacheable tasks which could’ve been misconfigured to be not cacheable).
Identifying bottlenecks: Making sense of data
We had all tools in place to measure various parameters on developer machines.
Next up: Bringing all data to a place where they can be analysed.
So we set up an ELK system, which captures all the data produced by the build monitoring tools and collates them in a place where we can visualise them. Visualising gives a broader picture of what’s happening on builds across the 140+ mobile developers that are working on our Super App.


Removing the bottlenecks
After being aware of all bottlenecks that caused slow builds, we went ahead fixing each of them.
Our findings
We found out that there were broadly 3 problems causing slower builds:
- High network usages due to wrongly configured Gradle
- Bad Caching: Gradle task output not being cached so all non-cached task executes on subsequent builds, etc.
- Inconsistent build environment among developer machines
The fix
High network usage due to misconfigured Gradle Dependency (resolution strategy)
cacheChangingModulesFor configuration property was set as 0, which was causing dependency artifact to be downloaded on each build. We removed this property because we wanted to download the artifact only after a version update.
In the Gradle build configuration phase, Gradle configures all projects which are taking part in the build.
Optimising the way repositories are configured helps reduce the number of network calls made during the configuration phase.
1. Targeted repository resolution: We tried to add a specific repository URL as much as possible. The advantage of this is, it will try to download dependencies from specified repositories rather than looking for dependencies in all known repositories.
The above code-snippet makes sure that fabric artifact is looked up only from fabric repository rather than all known repositories.
2. Reordering repository handlers according to their response time and availability.
E.g.: We have seen jCenter having multiple downtimes in past years. So we have made it the least priority in the list. This enables Gradle to hit jCenter as the last resort.
Have a look of the ordering of Gojek’s repository handler priority:
We choose the below maven mirror URL because this URL has the best response time for us compared to other reason’s maven-central servers.
https://maven-central-asia.storage-download.googleapis.com/repos/central/data/'
Optimise build execution time
Build execution time can be reduced by caching the executed task results. We wanted to cache the tasks result as much as possible and Build Scan helped a lot in finding the cause of the task not being cached. There are many ways to increase build-cache usage:
- Use multi-module
- Enable kotlin build cache
- Enable kapt build cache
- Use gradle-remote-cache (used in CI builds so far)
- Avoid override task output
Upgrade build system
Gradle and the Android team are working aggressively to make build faster after the release of AGP Version 3, so it is very important to keep your build system plugins (Gradle and Android Gradle plugin) updated.
Note: Years back, developers were confused with AGP and Gradle, and thought they both are the same, but they aren’t. 🤷♂️
Create build variant for development
Reducing the number of screens, locales, min SDK would lead to faster builds. E.g.: Building only for en, xhdpi, minSdk version 28 would take less time than building for all supported languages, screen densities, etc.
Developers define these values in their local.properties, and pick and set these values during build.
Our local.properties file looks like this after these changes:
Here’s how we read these config values from local.properties file:
Note: Our build already had the implementation of local-aar. In local-aar, we publish and use android archives of library modules for faster iteration.
Verifying the fixes
Before we could rollout the optimisations to developers, we had to test the them in various environment configurations. This is where the Gradle Profiler tool helped us.
Gradle Profiler allowed us to benchmark build times across different environment configurations to arrive at optimal settings.
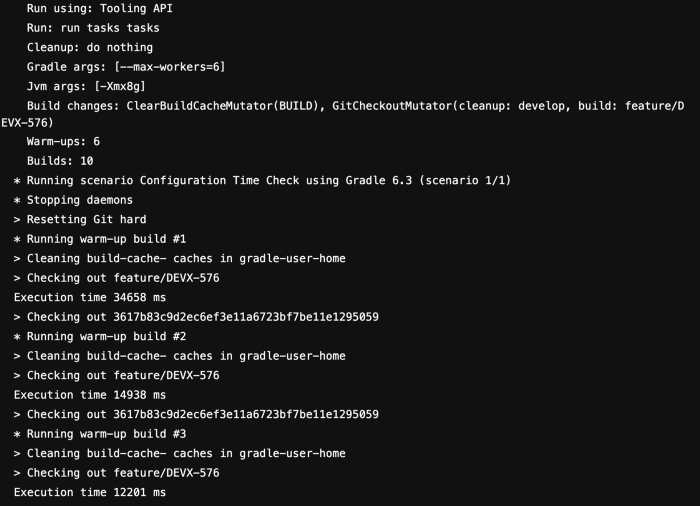
E.g.: gradle-profiler configuration to measure build configuration time.
As you can see above, we have set up jvm-args, gradle-args, and two git branches to compare the build configuration time. You could know more about the configuration setup from the gradle-profiler GitHub page. We were also able to see how Gradle daemon behaves after the n-th build using this awesome tool.
When we run this scenario using gradle-profiler, it runs the build multiple times to warm up the demon, enables the profiler and runs the builds. It also prints time on the console for each run. Profiling information can be captured using multiple tools.
We used build-scan to measure all warmups and measure build information.

Note:
- We have set up multiple scenarios like configuration time, debug build time, and test scenarios to compare the output.
- We have run this tool mostly on the CI machine because this tool takes a huge amount of system memory for profile or benchmarking. So, make sure to assign a good amount of memory before run profiling/benchmarking.
The results
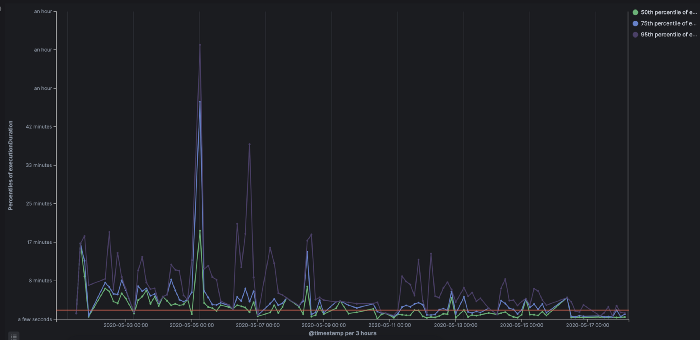
We used percentile to measure the impact. Since there are 140+ engineers, and build times are always varying to some extent, it’s not possible to exactly measure the build times reduction to an accurate number. Percentiles give us a way of measuring how build times are reducing in the population and the range of reduction.


General tips to keep in mind
- It is really important to tweak JVM arguments in your gradle.properties. We can’t suggest a specific value because it really depends on the developer machine configuration. Talaiot tool helped us a lot to generalise the value for Gojek consume app. This value which worked fine to us when we have 210+ Gradle modules: “org.gradle.jvmargs=-Xmx6g -XX:MaxMetaspaceSize=1g -Dkotlin.daemon.jvm.options=”-Xmx3g” -Dfile.encoding=UTF8”.
- Think twice before adding anything in allprojects and configuration blocks, because configuration inside these will apply on all modules in the project.
- Avoid creating modules as an android library module and create Kotlin/Java modules if no android API/resources are required in that module. This helps to reduce module compilation time.
- Try to define android config, kotlin config, and test config in a central place to avoid duplicate code. We would suggest using the buildSrc module for all build-system related tasks.
- In some cases, build speed optimisation and build memory optimisation are inversely proportional to each other. E.g.: Enabling kapt cache can consume more memory and can cause OutOfMemoryExceptions during the build. In this case, you either need to assign more memory to Gradle daemon or disable kapt cache.
- Try to cache build configuration output using configuration cache. Configuration cache will help in reducing build configuration time.
After all these efforts, our devs are happy and so is the business. 💚
The team that made all this possible:
Dinesh, the Engineering Manager for devX (Tooling, Infra and Build System).
Satyarth, the Architect for devX. He loves meddling with Gradle and calls himself a Gradle activist.
Prathyush, a Software Development Engineer in the devX team. Kubernetes and infra excite him.
And me, a Software Development Engineer in the devX team. I love helping developers stay productive.

Want to read more stories from the vault? Check out our blogs!
