Loki: Our Chaos engineering tool for Data Infrastructure at GO-JEK
Building confidence in system behaviour through disaster simulation experiments

By Ravi Suhag
It’s important for us to build a resilient and scalable data infrastructure when we have 18+ products. This means designing systems that can sustain operations in the face of failure.
Built on the principles of Chaos Engineering, and tailored to our specific use cases, Loki is our internal disaster simulation and load testing tool. It helps ensure our data infrastructure can tolerate random instance failures. Exposing engineers to failures frequently incentivises them to build these resilient services.
Features:
- Disaster simulation: Loki can randomly terminate virtual machine instances, containers and cluster nodes that run inside our production/performance environment.
- Load testing: Loki can launch multiple instances of data feeders and consumers at desired load state on any of our data streams.
- Network testing: Loki can simulate network connectivity issues.
- Reports: At the end of a simulation, Loki can prepare disaster recovery playbook and reports. These playbooks act as the foundation of our auto healing service, Thor.
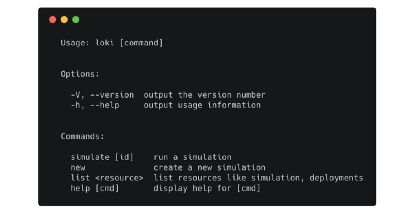
- CLI interface: Loki has an easy to use command line interface for running and monitoring any experiment.
Architecture
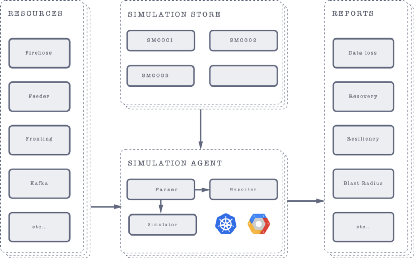
- Resources: Resources are the data infrastructure components on which Loki can operate.
- Simulation store: Every disaster simulation experiment is represented as a JSON schema. The simulation store holds information about all simulations ever run.
- Simulation Agent: The simulation agent takes care of parsing simulation schemas and running specified operations on resources.
- Reports: As the simulation agent runs, the reporter takes care of monitoring system state, experiment timings and also reporting. This helps us provide detail on data loss, recovery recommendations etc.
Process
We replicate our production infrastructure to a performance infrastructure which is used to run all experiments.
These experiments typically consist of four steps:
- Define system’s “steady state” — based on measurable output like overall throughput, error rates, latency, etc.
- Hypothesize about the steady state behavior of an experimental group, as compared to a stable control group.
- Expose the experimental group to simulate real-world events such as server crashes, malformed responses, or traffic spikes.
- Test the hypothesis by comparing the steady-state of the control group and the experimental group. The smaller the differences, the more confidence we have that the system is resilient.
To explain the process, I will be covering one of the case study experiments we ran on our mainstream data cluster using Loki.
Environment setup
Our mainstream data cluster is 6 brokers, 5 zookeeper nodes, multi-zone Kafka cluster. The first step is to replicate the infrastructure, state and identify running load and equivalent simulation load for the cluster. To setup the environment, we use Odin, an internal tool built on top of terraform and Ansible for infrastructure automation.
Steady state:
- Full ISR, No leader skew, No broker skew
- Produce time < 20ms
- Combined consumers lags < 1k
- No data loss
Simulation scenarios
Once the performance environment is up and configured with Loki, the next step is to create simulation schema using Loki cli tool. An example simulation looks like this.
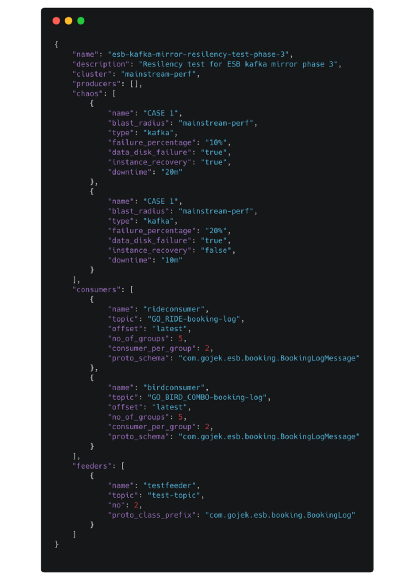
To test the resiliency of our stream cluster, we run chaos with different failure combinations.
- Broker failure and recovery with same broker id - with and without data disk loss.
- Broker failure and recovery with different broker id - with and without data disk loss.
- Brokers failure ranging from 10% of the cluster to 80%.
- Downtime simulation from 10m to 90m.
- 50 simulated consumers with different consumption and offset rates
- 100 feeders with
10K RPM - Mirror workers with
batch size= 10andlinger.ms = 1
Each simulation schema has its own id used by Loki run command to launch the experiment.
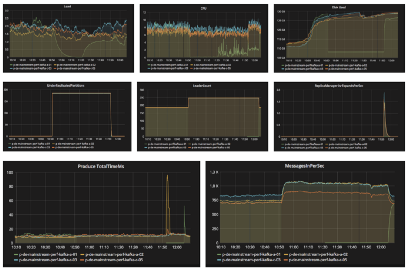
Monitoring
Loki monitors the state of the system over time during the experiment. It continuously monitors the deviation from steady state and recovery time once the system recovers from downtime.
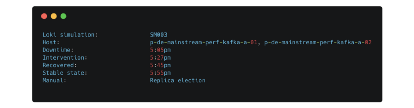
For data streams, reports include detailed information like
- Amount of time taken to reach stable state — full ISR, no leader skew, no broker skew
- Kafka produce time
- Consumer lag and status
- Producer state
- Failure point for each subsystem in isolation
- Any data loss
- Detailed metric dashboard
Conclusion
We started Loki to load-test new data infrastructure components and build confidence in our infrastructure. At the moment we run Loki on fresh infra and performance replica. But soon enough, we will also use Loki to run chaos engineering on production infrastructure as well - this gives us the confidence to move quickly in a complex system. You can read more about our Data Infrastructure here:
If you like what you’re reading and interested in building large-scale infrastructure that excites you, do check out our engineering openings at gojek.jobs. As always, would love to hear what you guys think.