How we monitor application performance at GO-JEK
StatsD, Telegraf, InfluxDB and Grafana

By Mudit Maheshwari
We’ve almost completed the transition from our monolithic origins to a full microservices architecture. When scaling, it becomes essential to monitor all our services in real-time.
Currently, we use third party apps to monitor our services and are in the process of moving to our own monitoring systems using StatsD, Telegraf, InfluxDB and Grafana. While third party apps does the job well, it was imperative for us to make a shift. Why? We’re growing faster than we can possibly imagine:
- We are operating at a scale where we cannot rely on third party products to scale and need in-house products.
- We are strong supporters of Open Source Software. Our new monitoring systems use only open source products.
- With hundreds of microservices, third party apps doesn’t offer certain customisations we’re looking for and more.
How do we collect and aggregate data?
We use StatsD for collecting different metrics. StatsD started life as a simple daemon developed and released by Etsy to aggregate and summarise application metrics. It parses messages, extracts metrics data, and periodically flushes the data to a time-series data sink.
With StatsD, applications can be instrumented by developers using language-specific StatsD client libraries.
Data types supported by StatsD
StatsD allows you to capture different types of metrics depending on your needs. The metric types are:
- Counter: Count occurrences of an event. Counters are often used to determine the frequency at which an event is happening. Example: authentication failures, response codes(2xx, 3xx, 4xx and 5xx).
- Timers: Measure the amount of time an action took to complete, in milliseconds. Example: response time of APIs
- Gauges: Arbitrary, persistent values. Once a gauge is set to its value, the StatsD server will report the same value each flush period. Example: memory usage, SHA of latest deployed commit.
- Sets: Report the number of unique elements that are received in a flush period. The value of a set is a unique identifier for an element you wish to count. Example: number of active users.
We have chosen Telegraf for our StatsD server. Telegraf is an agent written in Golang for collecting, processing, aggregating, and writing metrics. Since it’s written in Go, it’s comparatively efficient and uses a lot of advantages Go comes with.
Where do we store the data?
Telegraf periodically flushes the data to InfluxDB after collecting and aggregating the metrics. InfluxDB is a NoSql database specialised in storing time-series data. InfluxDB is also written in Go and designed to handle high write and query loads. We configured InfluxDB to keep data for a defined length of time, automatically expiring & deleting any unwanted data from the system.
How is the data visualized?
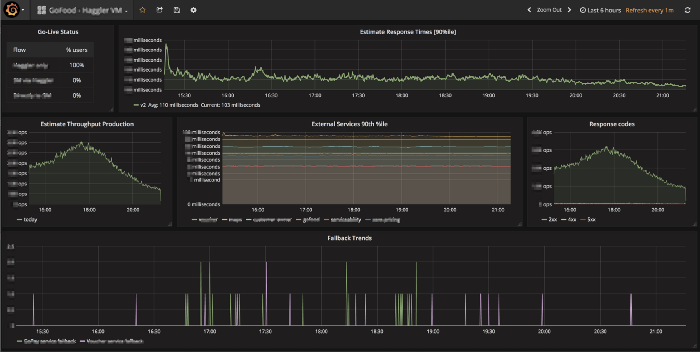
We use Grafana to visualise and analyse data collected in InfluxDB. It‘s an open platform for beautiful analytics and monitoring. The generated dashboards are not only good looking but Grafana does an excellent job in making query editor so simple and powerful. Setting up a new dashboard in Grafana is really smooth.
How do we bring Intelligence?
We are continuously iterating our systems by tracking different metrics to make it scalable, reliable and fault tolerant. Some of the metrics we monitor:
- Number of API calls and its response time give better insights to optimise.
- Count of response codes by external services to implement better fallbacks.
- Measure disk usage, load, memory available etc to achieve 100% uptime.
- Track same parameters for different implementations to find which is best.
Any other tips, suggestions, best practices you like to share? Please leave a comment below.
For interesting career choices, look up gojek.io/careers :)