How We Monitor Apache Airflow in Production
A quick guide on what (and how) to monitor to keep your workflows running smoothly.

If your organisation deals with a significant amount of data and has huge data pipelines, chances are you must have used or heard about Apache Airflow already. Airflow is an open-source workflow management platform that enables scheduling and monitoring workflows programmatically.
At Gojek, our products generate a tremendous amount of data, but that’s only step one. We’re constantly making use of that data and give value back to our customers, merchants, and partners — in the form of recommendations and other customisations. The ‘Data Engineering’ (DE) Team is responsible for building the platform and products to manage the entire lifecycle of data.
Needless to say, Airflow is one of our most heavily used tools. We cater over a thousand pipelines and an enormous amount of data using Airflow. Monitoring all these pipelines is not easy — especially considering that Airflow is still in its early phase.
Like any production application, it becomes crucial to monitor the Airflow jobs and of course, Airflow itself. It has a very resilient architecture and the design is highly scalable. It has multiple components to enable this, viz. Scheduler, Webserver, Workers, Executor, and so on. At Gojek, we have a few additional processes as well to enable flexibility for our workflows.
For example, we have a separate process running to sync our DAGs with GCS/git and a separate process to sync custom Airflow variables. We know very well that, the more components you have, higher the chances of failure. Hence, this requires a thorough monitoring and alerting system.
High-level architecture
At a high-level, we have multiple Airflow processes running in our different Kubernetes Pods, and each of them has a statsd client enabled using airflow.cfg. The statsd client will send all the metrics to Telegraf over UDP. Our custom processes are also emitting those heartbeats and other data in the same way.
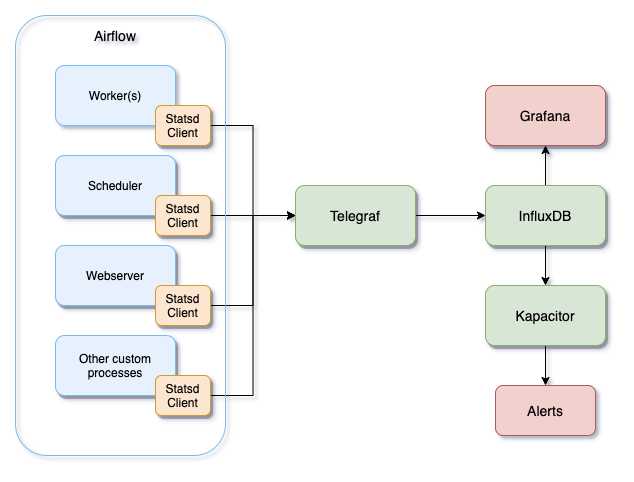
We’ve configured InfluxDB as an output for Telegraf configuration (telegraf.conf) which will send the data over HTTP. You can add InfluxDB as a data source in Grafana as well as in Kapacitor. The alerts can now be configured in Kapacitor using TICK scripts which we’ll cover in the next sections.
Understanding Airflow statsd metrics
Airflow’s implementation and documentation of metrics are not the best things about it and it’s still in the early stages. In the first attempt, the measurements created by Airflow in InfluxDB were not how we wanted them to be. We solved that by writing some custom statsd telegraf templates based on the metrics name. Some of them are:
 262588213843476
These templates will create some meaningful measurements named prefix_dag_duration, prefix_dagrun_schedule_delay, prefix_dag_loading-duration, etc in InfluxDB which can be easily queried using Grafana/Kapacitor. Following is a sample of how the fields (or tags) are parsed in InfluxDB:
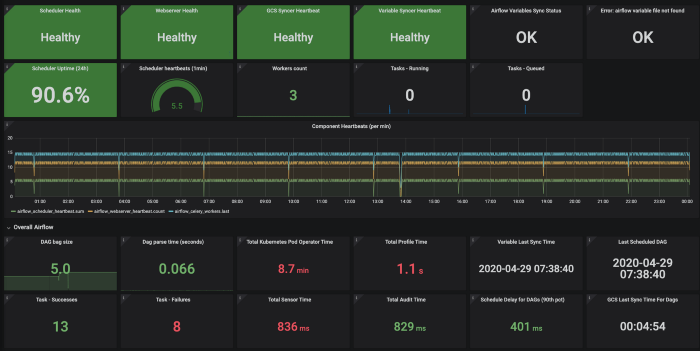
262588213843476The tags enable higher flexibility for querying and filtering the data. We built a Grafana dashboard on top of it as the first goal to see what’s happening under-the-hood. A sample query to generate a time series trend in Grafana for the above measurement is:
262588213843476What should you monitor?
The following list contains some of the important areas that you should monitor, which could also be helpful for debugging and finding bottlenecks for resources:
- Health checks: Are scheduler, webserver, workers, and other custom processes running? What’s their uptime?
- How many workers are running?
- Are our custom metrics and configurations being reflected in metrics?
- Number of active DAGs, and DAG parsing time
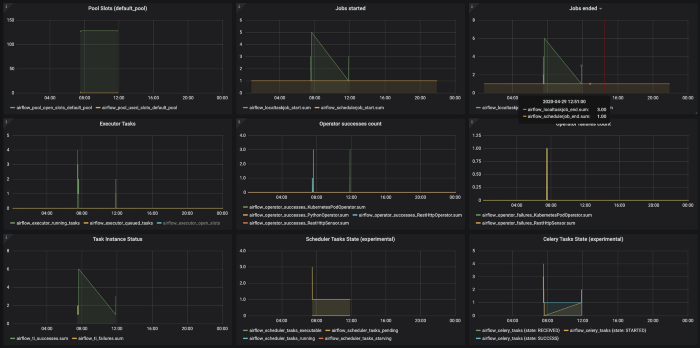
- Trend: Pools usage
- Trend: Jobs execution status (started/ended)
- Trend: Executor tasks status (running/queued/open slots)
- Trend: Operator-wise execution status (failure/success)
- Trend: Task Instances status (successes/failures)
- Trend: Time taken by crucial tasks, sensors
- Trend: Time taken by the DAGs before coming to an end state
- Trend: Schedule Delay of DAGs
- Trend: Time spent by DAGs for completing dependency checks
It’s important to track these metrics at an overall level, as well as individual tasks and the DAG level. You should also consider tracking your specific operators and tasks that you think have higher chances of failure and/or consume more resources.
Alerting
Now that we have data in InfluxDB, and the monitoring is in place, we can use Kapacitor to write the TICK script to trigger alerts based on the checks and thresholds. The following snippets show some sample alerts that can be set.
// alert if scheduler is down.
stream
    |from()
        .measurement('prefix_scheduler_heartbeat')
    |deadman(0.0, 5m)
        .id('AirflowSchedulerDown')
        .message('Airflow Scheduler is down')
        .log('/tmp/alert_logs.txt')
        .trigger_alert_method()
// alert if worker count does not match the required value
stream
    |from()
        .measurement('prefix_celery_workers')
    |window()
        .period(5m)
        .every(5m)
    |alert()
        .id('Celery Workers Count')
        .crit(lambda: "value" <= 2)
        .warn(lambda: "value" <= 3)
        .log('/tmp/alert_2.txt')
        .trigger_alert_method()
Apart from this, it is also important to monitor the health of InfluxDB, Kapacitor, and Grafana as well.
References
- https://airflow.apache.org/docs/stable/metrics.html
- https://docs.influxdata.com/kapacitor/v1.5/tick/introduction/
Thank you, everyone, at the DE team — we build and manage the components described above, and special thanks to Sravan for the discussions and pairing. If you’ve questions, let us know in the comments or tweet me.
