How We Estimate Food Debarkation Time With 'Tensoba'
GoFood, our food delivery product has millions of customers. Overall waiting time plays a huge role in customer satisfaction. Here's how Tensoba helps.

Authors: Alamsyah Koto Hanza, Mathangi Sri, Hareesh Gujja, Mayank Khera, Aditya Datta, Abhinav Tiwary, Sruti Rallapalli
GoFood serves millions of customers every day in Indonesia. We believe reliability is one of the keys to making the customer return to the product.
Based on our research, one of the most influential factors to customer satisfaction is overall waiting time.
Obviously, the faster food is served, the higher the customer satisfaction. Therefore, reducing the GoFood delivery time is imperative to increase customer satisfaction. However, there are limited levers to reduce food delivery time and hence we focus our attention on setting expectations.
Customers want to understand certain parameters at a merchant level before deciding to order. Delivery time is one of the key influencing factors of conversion rates. Historically, we have seen lower Estimation Time Arrival (ETAs) have higher conversion rates — it shows with a negative correlation factor of 53% between ETA and conversion rates. It means if the ETA is far higher than Actual Time Arrival (ATA), then the odds of customers making the order will reduce. Meanwhile, if the ETA is far lower than ATA, then the customer will not trust GoFood in the future.
As part of the solution for this reliability problem, GoFood intends to increase customer confidence in ETA in the application. The confidence will make the customer trust the ETA and choose orders with the most convenient ETA for them.
Tensoba
It produces estimation time between Gofood drivers accepting an order and the actual time of arrival to the customer.
ETA on GoFood
In GoFood, there are two types of ETAs: the ETA that is shown before the checkout page called ETA Discovery and ETA on the checkout page called ETA Checkout.
ETA Discovery is useful for customers to compare which customer will serve food generally faster than the other. It will depend on the type of food and how far the restaurant usually serves customers.
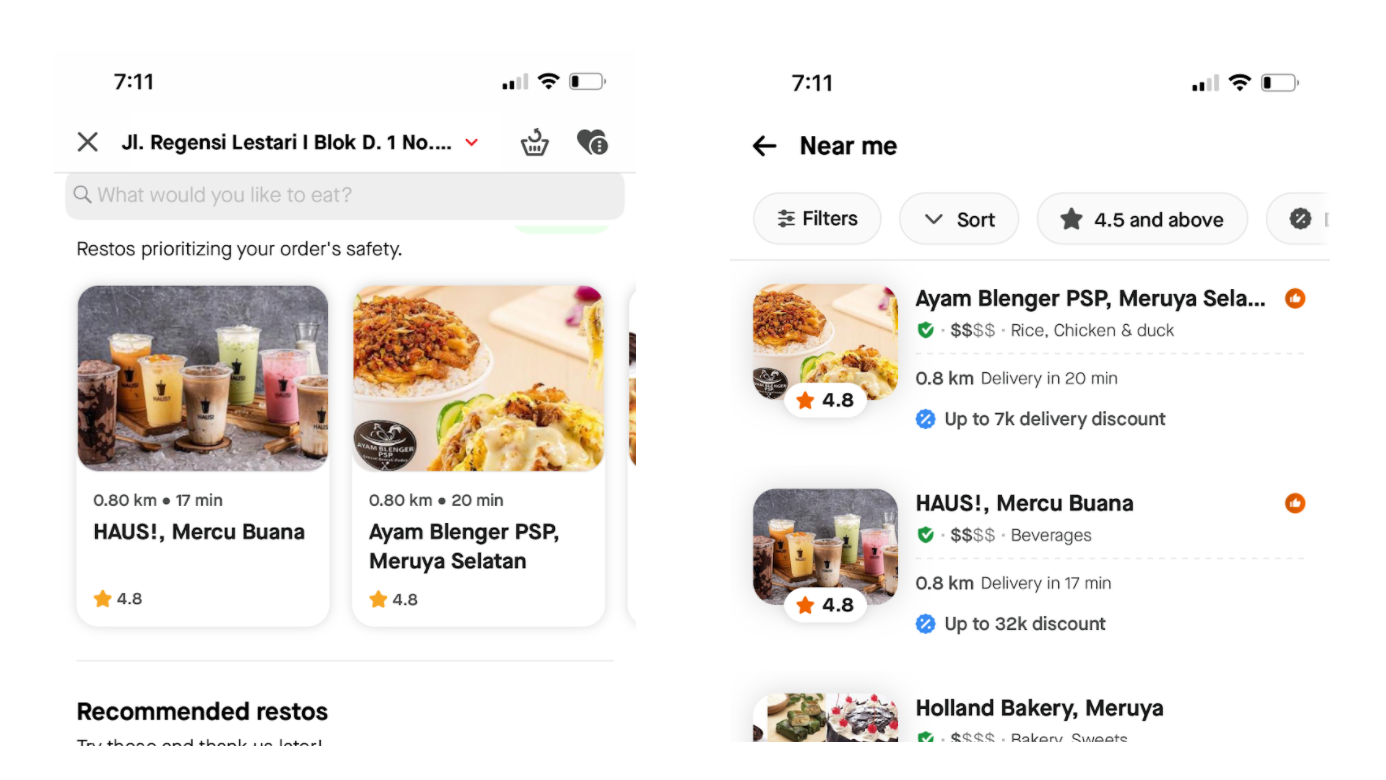
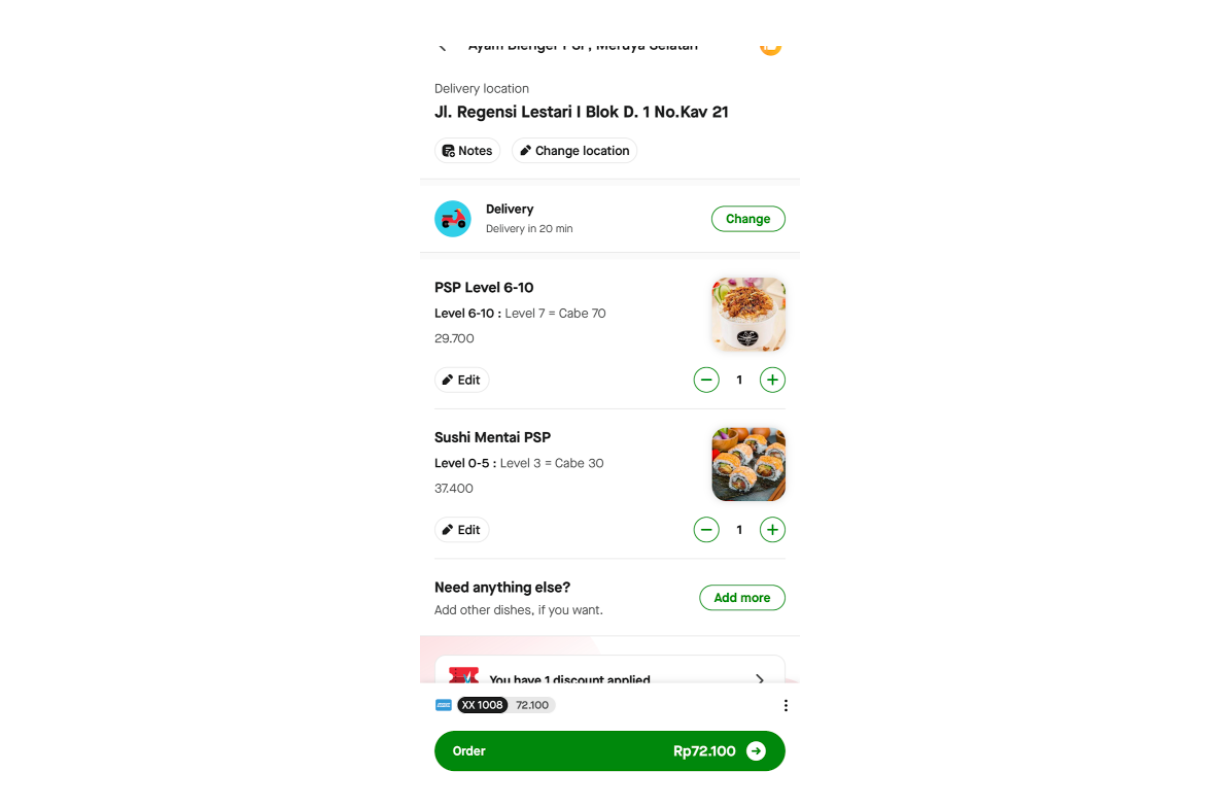
Meanwhile, ETA Checkout will give information to customers about exactly how long they will get the food since they start to order. It depends on the cart of the order, the distance of customer location to the restaurant, and when the customer does the orders.
Framing the problem
This ETA problem in GoFood has the main goal to predict how long the food will arrive since the order creation in minutes or seconds. Since the target is seconds or minutes, which is a numerical target, this problem can be framed as a Regression problem. Here are the flows to framing this problem into a machine learning regression problem :
Firstly, Predicting time arrival from a particular merchant can be done by tracking the trend of time arrival from previous orders. As shown on the plot ATA from 3 different merchants below:
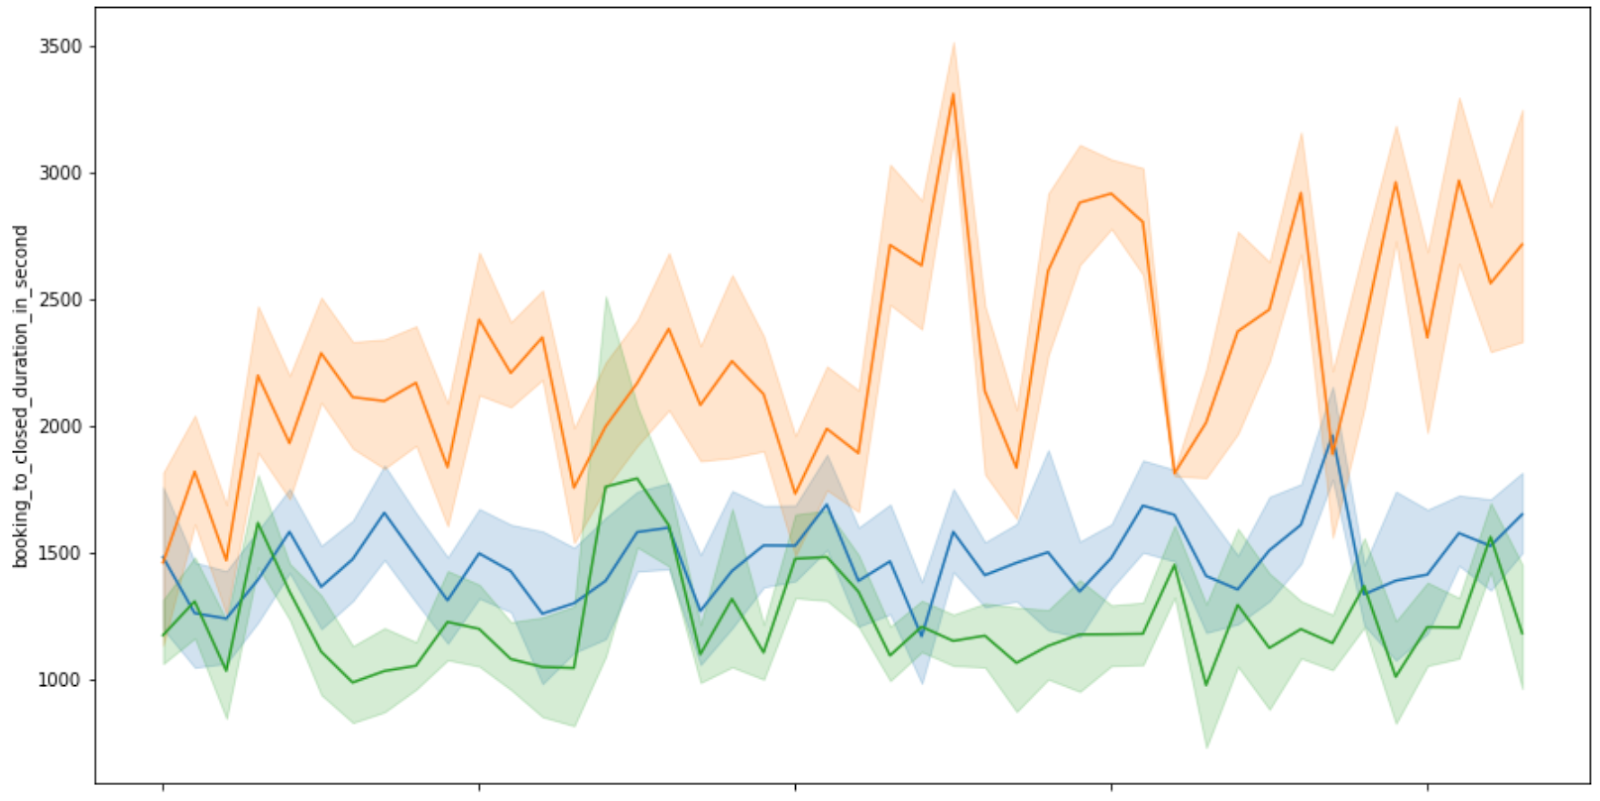
Different merchants will have different trends, meanwhile, within the merchant, the ATA of orders is always within a certain range. Therefore, the problem can be framed as a time series problem for each merchant. This approach, however, will not be an optimal solution since GoFood has over 300.000 merchants nationwide.
Secondly, we transform every merchant into a vector that contains the past movement of its ATA. It means for every merchant we can calculate its average of ATA for the past weeks or months. Not only average but also the standard deviation or percentile. Unlike a time series problem, which is mostly impacted by the historic series of data, ETA is impacted by order-level features, for instance, traffic, distance, or type of food ordered. Therefore, for each order, there will be merchant level features and order level features as predictors. These features can be used as predictors for ETA for each order. Furthermore, the ETA problem can be approached as a Machine Learning regression problem instead of a time series problem.
Metric performance
There are several metrics that need to be considered in building the Tensoba Model. We divide the metrics into offline and online metrics. Offline metrics are the metrics for evaluating the model accuracy, meanwhile, we are using online metrics to see the impact of the model on the product which is usually measured once the model is deployed.
Offline metrics
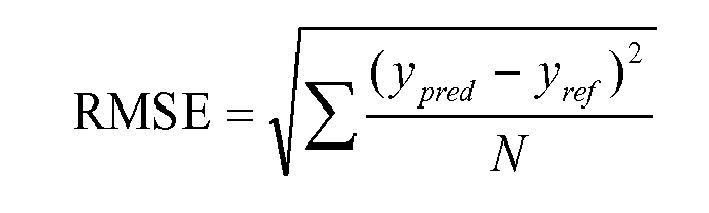
There are 3 metrics for checking the Tensoba accuracy to the actual time of arrival: RMSE, MAE, and MAPE. Firstly, RMSE or Root Mean Squared Error is an interpretable metric that gives more weight to the higher error. It means RMSE is sensitive to high error. This is the formula of RMSE,
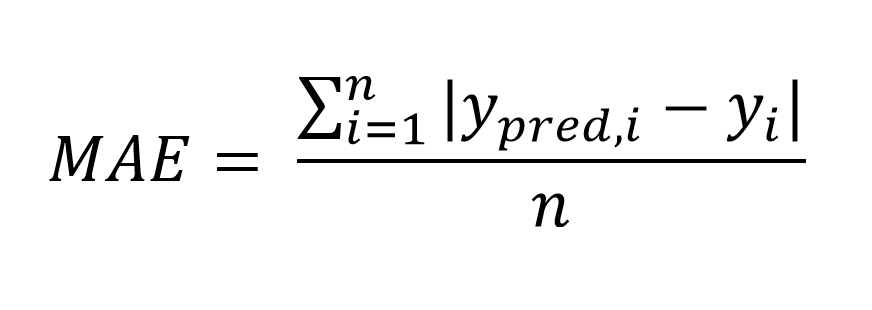
Secondly, MAE or Mean Absolute Error is a metric with an absolute error of the model and averages it instead of rooting the error square. It means, there is no weighting among errors while all the errors are being treated the same. So, if the higher error will NOT give a higher risk on the prediction, then use MAE. This is the formula of the MAE,
Lastly, MAPE or Mean Absolute Percentage Error metrics is the same as MAE but it’s normalized by the true value which will give information about how many percent far the prediction is to the true value. Also, because the metric uses “mean”, it is highly influenced by extreme values. MAPE can’t be used if the true values contain zero. Therefore, as long as the true value is NOT zero and the normalized value of the error is desired then use MAPE. Here is the formula:

Online metrics
We measure Tensoba using 2 metrics in production: its compliance and conversion. Compliance is about how the eta will comply with the actual time of arrival, it means that when the customer expects the arrival time then it should not exceed the actual. In other words, the Tensoba must have a small underpredict and tends to overpredict. We assume that if the customer is not happy with our compliance they won’t trust our ETA or our service in general.
On the other hand, too high ETA will make customers anxious which leads to not converting to the booking after discovery on our platform. Therefore, the second online metric that we need to monitor is the conversion of our sessions. It calculates how many percent of sessions end up with a booking.
Benchmark ETA
Our first attempt of displaying the ETA to the customer involved an approach based on averages. The time arrival is estimated using a simple average of Actual Time Arrival for the past 2 months of each restaurant. Here is the performance of our first approach:

The evaluations show that on average, the ETA error plus-minus 6.4 minutes with MAPE almost 32%. The next model should beat the error of this estimation.
ATA Components
There are two approaches to do this modeling:
- Use the total ATA from the data on order level as the model target. It is called wholesome prediction.
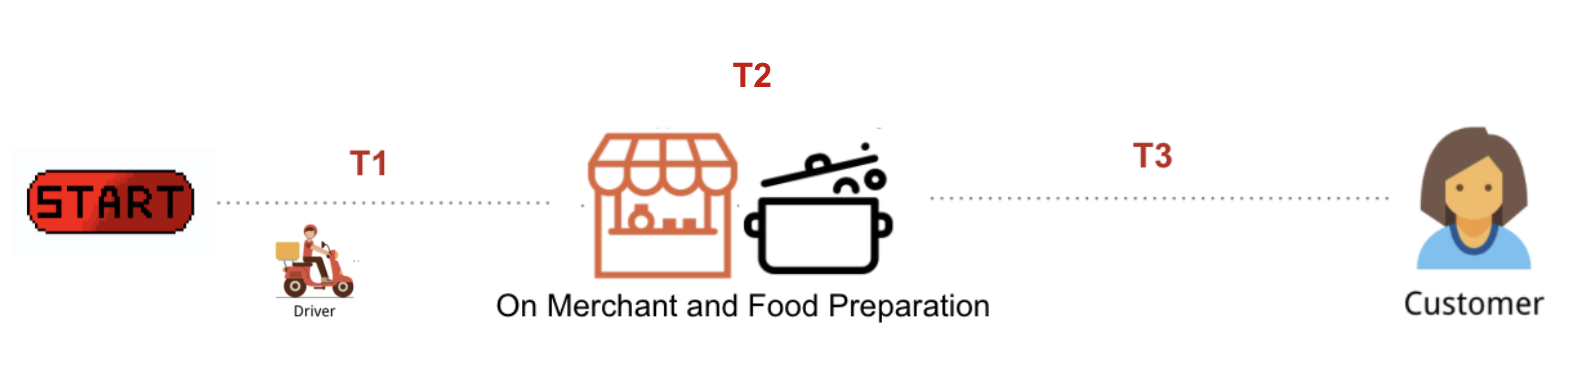
- Divide the ATA into 3 different phases and predict it independently, then combine the result. The ATA can be divided into 3 different components,
- The time between booking order to driver arrival to restaurant denotes as T1 (In Minutes)
- The time between driver arrival to driver pickup, basically the time of driver waiting time on restaurants like queue or parking until pickup denotes as T2 (In Minutes)
- The time between driver pickup to closing time or arrival time denotes as T3 (In Minutes)
Because of this, the Tensoba project will have 2 models (Discovery and Checkout) for wholesome prediction or 6 models (T1, T2, T3 for each Discovery and Checkout).
Model features and training
Tensoba models are using the XGBoost model with three weeks of data. Most of the features in Tensoba to predict T1, T2 and T3 is the summary of those targets on different levels. For example,
- The Average of T1 on Merchant Level within X last days → to predict T1
- The Percentile 75 of T2 on Item Type within X last weeks → to predict T2
- The Median of T3 on Distance Group Level within X last hours → to predict T3
- Etc
However, there are other features that need to be collected in real-time like :
- Value of the orders
- Number of items
- Route Distance between Customer and Drivers
Those real-time features are most likely being used on the checkout page since the information can’t be collected during Discovery.
Model Performance
The prediction of time arrival (ETA) will be the wholesome prediction or the total of the prediction of T1, T2, and T3. This is the best result (in Minutes) after several iterations:
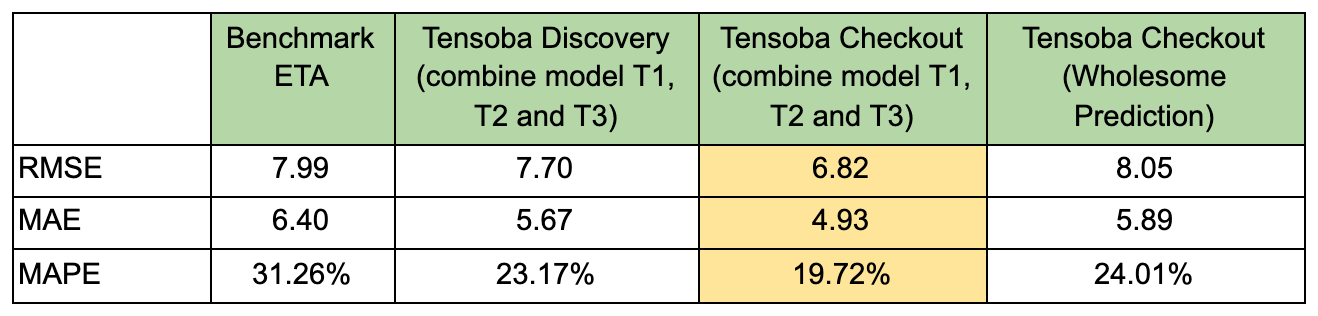
The table shows that the performance of separated Tensoba is better on Discovery and Checkout than Benchmark ETA and wholesome prediction. It reduces the MAPE from 31% to 23%, which means that the Tensoba ETA error is only 23% far from the actual time of arrival.
Feature Importance
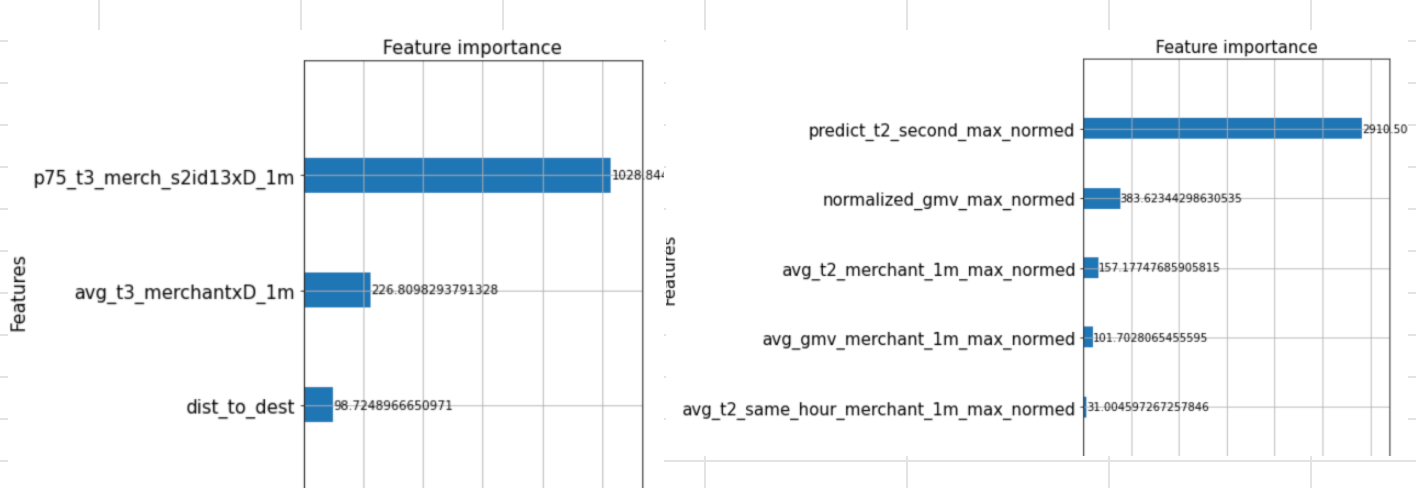
Based on the XGboost model, here are the top 3 features to predict each component.
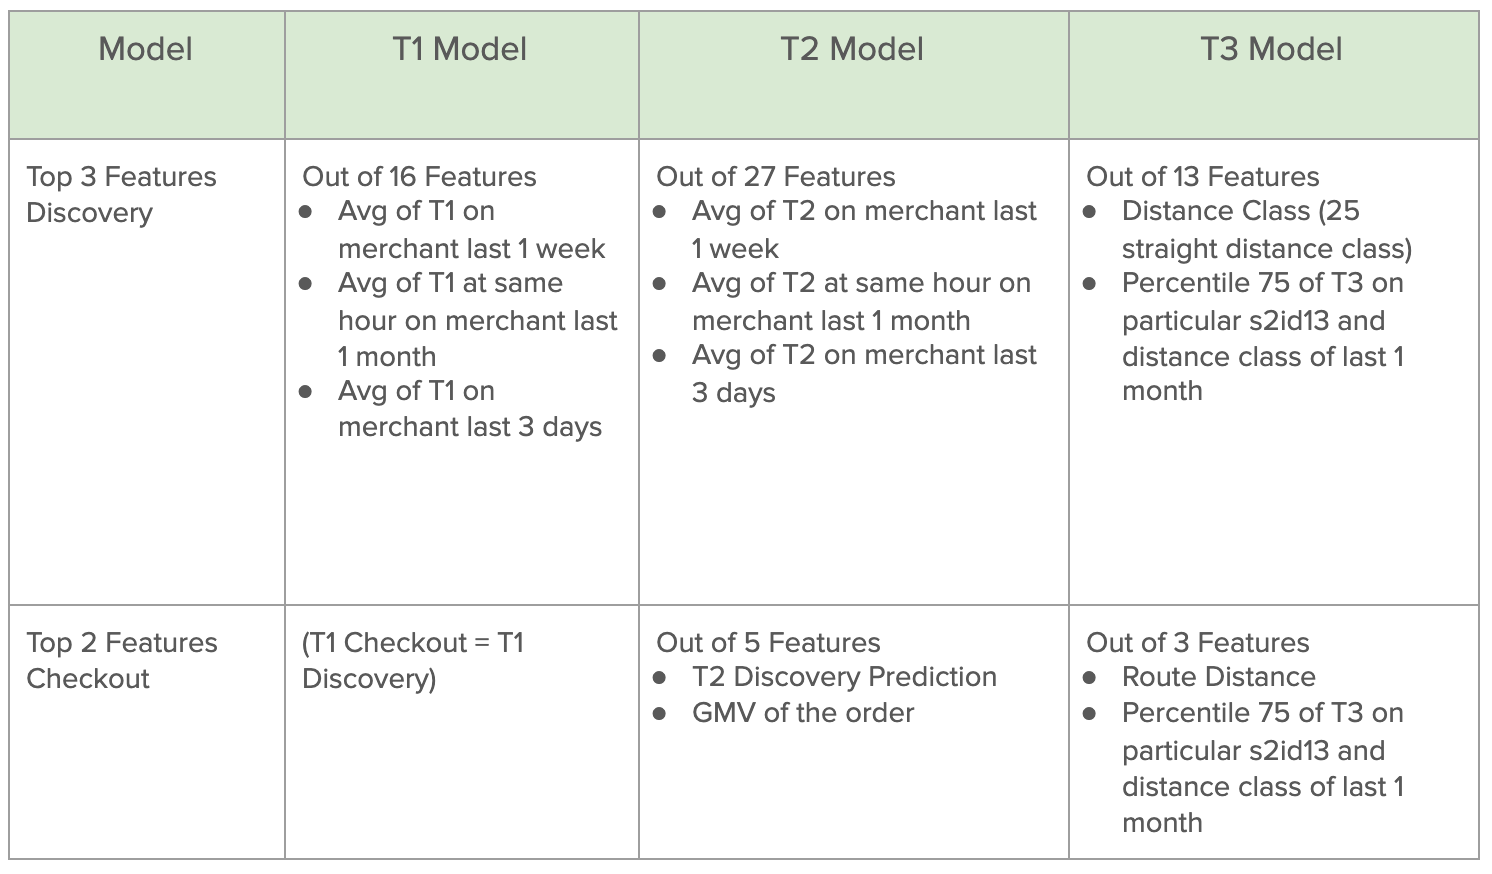
The table shows that T1 and T2 discovery is really reliable with the hourly, last 3 days, or weekly summary within the merchants. This fact kinda makes sense which states that the next T1 or T2 won’t be so much different from the previous T1 or T2 at the same hour and merchant. Meanwhile, the T3 discovery has a high dependency on the distance class. This result is in correspondence with the reality where the higher distance will lead to a longer time.
On the Checkout, T2 depends on the GMV order which shows that expensive orders generally will take a longer time to prepare. Also, as expected, the T3 checkout still has distance as the predictor. However, the p75 of T3 on the s2id level 13 is the best predictor so far which shows that for different areas T3 has different trends.
Implementation
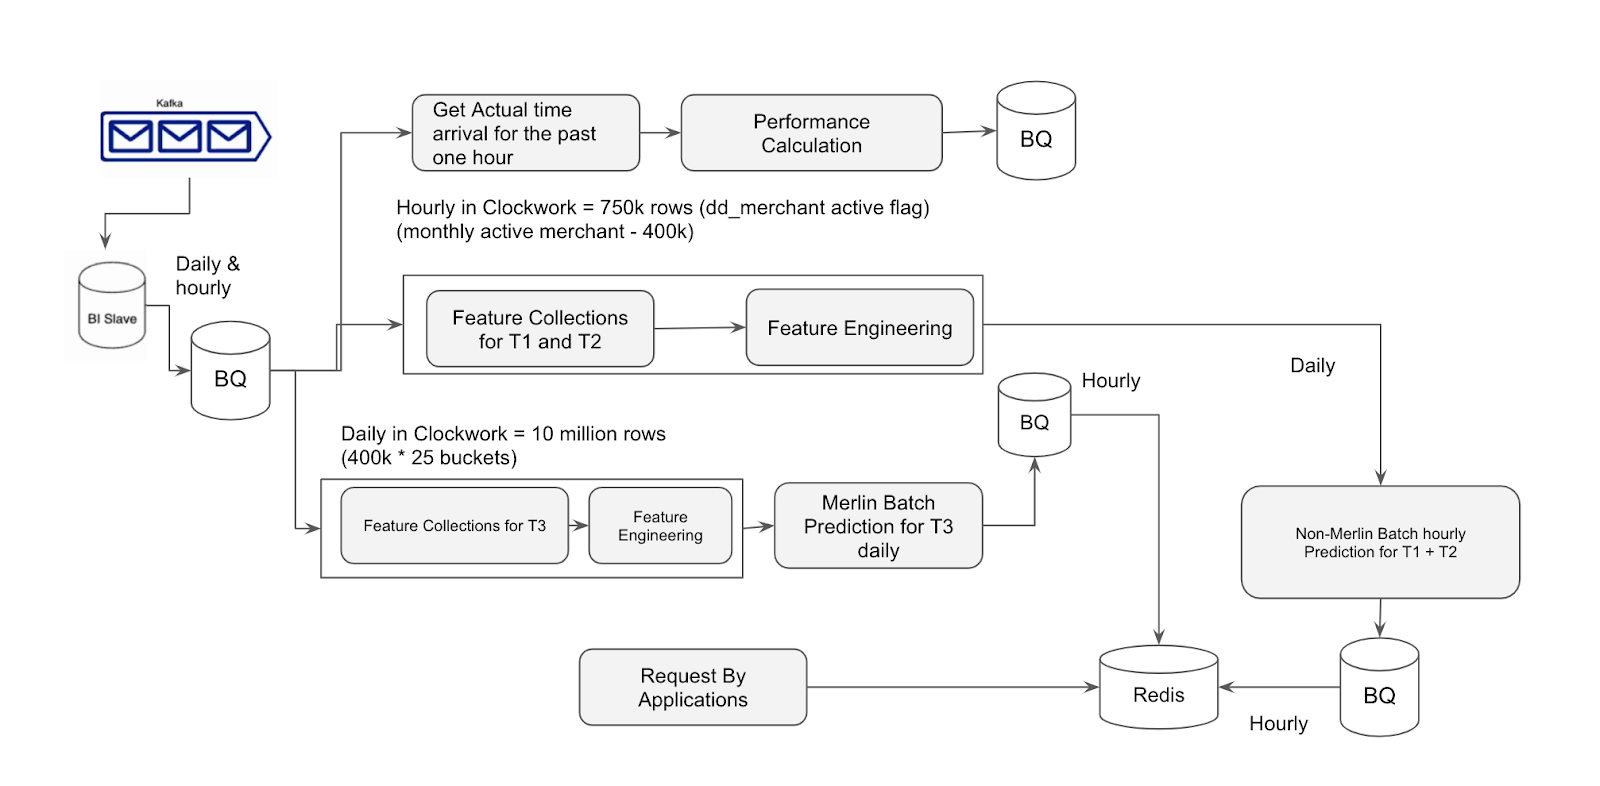
Tensoba Discovery implementation is not the same as the checkout. The implementation will depend on the level of the features. The smallest features level on T1 and T2 is “last 1 hour on specific merchant” features which can run every hour. Also, there are no features of Customer Location for these two cases, so the model will be the same for each customer and merchant on a specific hour. This makes it possible to run T1 and T2 hourly in a batch for each merchant.
Meanwhile, for T3, the smallest features level is “last 1 week data on specific distance groups in merchants” which can be updated daily. Therefore the T3 model in Discovery updates daily at 12 am in a batch that predicts all merchants T3 at all distance groups.
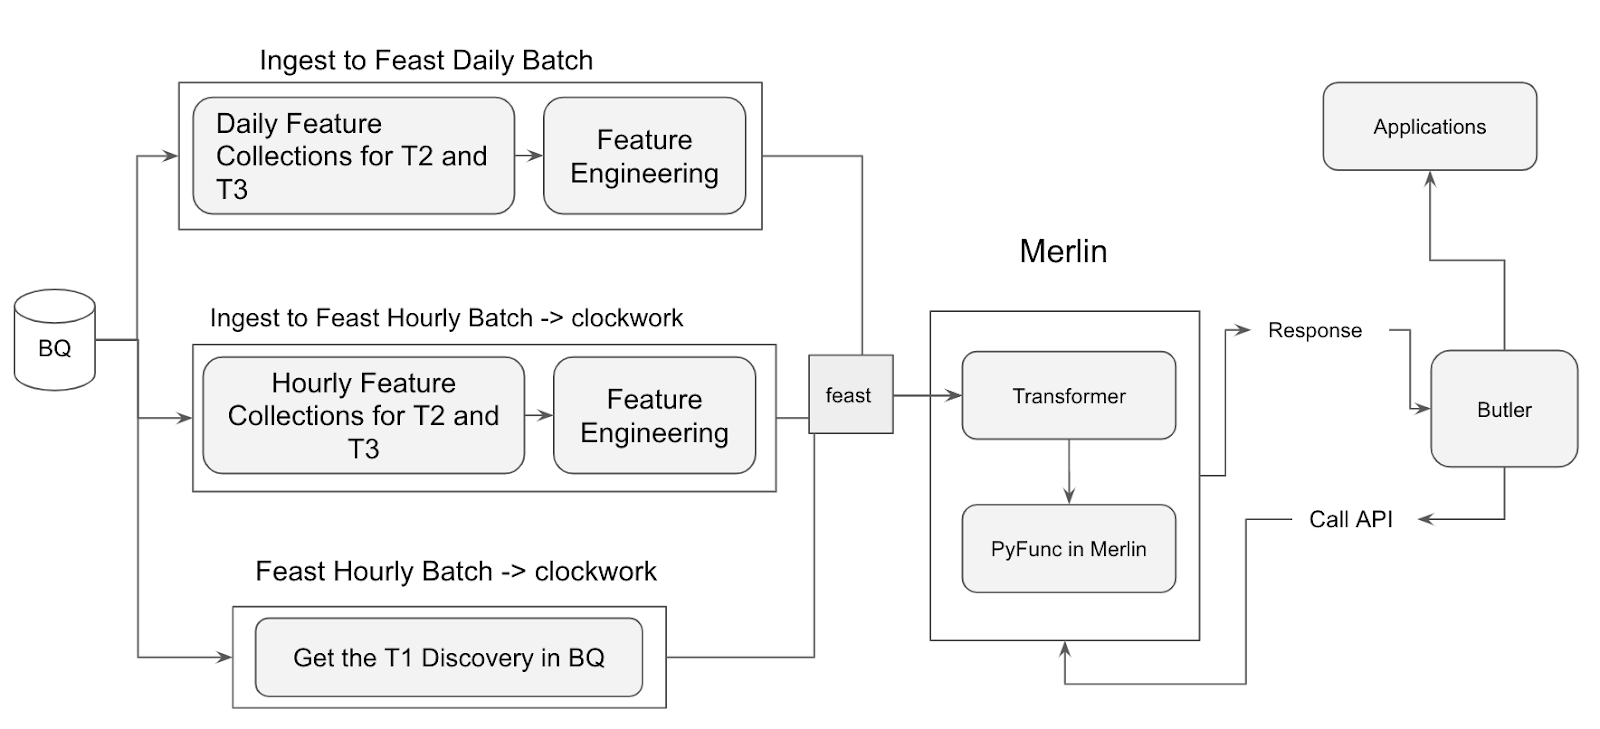
Technology at Gojek, such as Clockwork and Merlin from the Data Sciences Platform team helps orchestrate the implementation of different schedule batch predictions like above. Clockwork supports the scheduling, meanwhile, Merlin makes it easy to do batch prediction in such a short time. The hourly prediction is stored in Redis, then the application will search the time arrival prediction through it.
On the other hand, Tensoba checkout is a real-time prediction that uses information from the user’s order like route distance and order value. The model is deployed to Merlin using our Transformer which gets features from Feast in real-time. Merlin will release an API that can be used by applications to get the time arrival prediction.
Future improvements
Tensoba has decreased the error of estimation time by almost 23%, however, this model can still be modified to make better results. Here are some future plans of improvement:
- Implement a retraining schema to always get fresh data to the model.
- Adding features about how crowded the restaurant is or the way to get to the customer's destination.
- Add information about how likely the driver will accept the order.

Check out more stories from the vault here.
Oh, and we’re hiring: