[DIY] Set Up Telegraf, InfluxDB, & Grafana on Kubernetes
A guide to getting started with monitoring and alerting.
![[DIY] Set Up Telegraf, InfluxDB, & Grafana on Kubernetes](/content/images/size/w2000/2020/10/TIG-Stack-01.jpg)
By Ankit Deshpande
Infrastructure and application observability and monitoring plays a very important role in ensuring uptime and smooth operations of services and systems in production. Better visibility into system health helps in timely detection of anomalies.
How do you achieve this? Monitoring Postgres/Kubernetes clusters, VMs etc. can be done with the help of the TIG (Telegraf, InfluxDB, Grafana) stack. With the help of configurable plugins, you can track custom events/metrics emitted by applications, and alerts can be set up to notify teams of high CPU usage, error rates, and so on.
In this post, we’ll discuss how to setup this stack on Kubernetes.
Let’s start with some introductions
InfluxDB
InfluxDB is an open-source time series database. Being a time series database, it suits the intensive workloads of storing and retrieving time-based data like application metrics, system health metrics (CPU, Memory, Network, Disk) usage etc.
Telegraf
Telegraf is an agent for collecting, processing, aggregating, and writing metrics. It supports multiple outputs, InfluxDB being one of them.
Grafana
Grafana is an open source visualization tool. It is used to create dashboards, and offers features and plugins to make them dynamic.
Now that that is out of the way, let’s look at how we can setup Grafana, Telegraf and InfluxDB on Kubernetes (Minikube).
Note: This is not a production ready configuration/setup, this is for experimenting how TIG stack works and how to setup it up.
Prerequisites
- Access to K8 Cluster / Minikube / MicroK8
- kubectx
- kubens
- alias k=’kubectl’
We will setup the following components:
- Namespace (Optional)
- InfluxDB
- Telegraf
- Grafana
Setup Namespace
We will use this namespace to deploy all the K8 resources needed for monitoring
kubectl create namespace monitoringSwitch Namespace
Using kubens:
Select monitoring namespace (we can also specify this namespace in the resource definition)
Setup InfluxDB
For InfluxDB we will create:
- A secret(username password to connect to DB)
- Persistent Volume
- Deployment
- Expose this deployment using a service
Secret for InfluxDB
kubectl create secret generic influxdb-creds \
  --from-literal=INFLUXDB_DATABASE=local_monitoring \
  --from-literal=INFLUXDB_USERNAME=root \
  --from-literal=INFLUXDB_PASSWORD=root1234 \
  --from-literal=INFLUXDB_HOST=influxdb
Persistent volume for InfluxDB
apiVersion: v1
kind: PersistentVolumeClaim
metadata:
  labels:
    app: influxdb
  name: influxdb-pvc
spec:
  accessModes:
  - ReadWriteOnce
  resources:
    requests:
      storage: 1Gi
This persistent volume will be used by the InfluxDB container to store data across container restarts. StatefulSet Deployments can also be used for running InfluxDB pods.
InfluxDB Deployment
apiVersion: apps/v1
kind: Deployment
metadata:
  namespace: monitoring
  annotations:
  creationTimestamp: null
  generation: 1
  labels:
    app: influxdb
  name: influxdb
spec:
  progressDeadlineSeconds: 600
  replicas: 1
  revisionHistoryLimit: 10
  selector:
    matchLabels:
      app: influxdb
  strategy:
    rollingUpdate:
      maxSurge: 25%
      maxUnavailable: 25%
    type: RollingUpdate
  template:
    metadata:
      creationTimestamp: null
      labels:
        app: influxdb
    spec:
      containers:
      - envFrom:
        - secretRef:
            name: influxdb-creds
        image: docker.io/influxdb:1.6.4
        imagePullPolicy: IfNotPresent
        name: influxdb
        resources: {}
        terminationMessagePath: /dev/termination-log
        terminationMessagePolicy: File
        volumeMounts:
        - mountPath: /var/lib/influxdb
          name: var-lib-influxdb
      dnsPolicy: ClusterFirst
      restartPolicy: Always
      schedulerName: default-scheduler
      securityContext: {}
      terminationGracePeriodSeconds: 30
      volumes:
      - name: var-lib-influxdb
        persistentVolumeClaim:
          claimName: influxdb-pvc
InfluxDB Service
kubectl expose deployment influxdb --port=8086 --target-port=8086 --protocol=TCP --type=ClusterIPSetup Telegraf
For running Telegraf we will create:
- Secret (host, credentials to connect to InfluxDB)
- Config
- Deployment
- Service
- If running on Minikube, expose this service on Minikube so that it is accessible from outside the cluster
Telegraf Secret
apiVersion: v1
kind: Secret
metadata:
  name: telegraf-secrets
type: Opaque
stringData:
  INFLUXDB_DB: local_monitoring
  INFLUXDB_URL: http://influxdb:8086
  INFLUXDB_USER: root
  INFLUXDB_USER_PASSWORD: root1234
Telegraf Config
apiVersion: v1
kind: ConfigMap
metadata:
  name: telegraf-config
data:
  telegraf.conf: |+
    [[outputs.influxdb]]
      urls = ["$INFLUXDB_URL"]
      database = "$INFLUXDB_DB"
      username = "$INFLUXDB_USER"
      password = "$INFLUXDB_USER_PASSWORD"
# Statsd Server
    [[inputs.statsd]]
      max_tcp_connections = 250
      tcp_keep_alive = false
      service_address = ":8125"
      delete_gauges = true
      delete_counters = true
      delete_sets = true
      delete_timings = true
      metric_separator = "."
      allowed_pending_messages = 10000
      percentile_limit = 1000
      parse_data_dog_tags = true
      read_buffer_size = 65535
Telegraf Deployment
apiVersion: apps/v1
kind: Deployment
metadata:
  namespace: monitoring
  name: telegraf
spec:
  selector:
    matchLabels:
      app: telegraf
  minReadySeconds: 5
  template:
    metadata:
      labels:
        app: telegraf
    spec:
      containers:
        - image: telegraf:1.10.0
          name: telegraf
          envFrom:
            - secretRef:
                name: telegraf-secrets
          volumeMounts:
            - name: telegraf-config-volume
              mountPath: /etc/telegraf/telegraf.conf
              subPath: telegraf.conf
              readOnly: true
      volumes:
        - name: telegraf-config-volume
          configMap:
            name: telegraf-config
Telegraf Service
kubectl expose deployment telegraf --port=8125 --target-port=8125 --protocol=UDP --type=NodePortIf using Minikube, if you want services outside the k8 cluster to access this Telegraf service, use:
minikube service telegraf --namespace monitoringSetup Grafana
For Grafana we will create
- Secret (admin username, password to access Grafana)
- Deployment
- Service
- Expose on Minikube
Grafana secret
kubectl create secret generic grafana-creds \
  --from-literal=GF_SECURITY_ADMIN_USER=admin \
  --from-literal=GF_SECURITY_ADMIN_PASSWORD=admin1234
Grafana Deployment
apiVersion: apps/v1
kind: Deployment
metadata:
  namespace: monitoring
  annotations:
  creationTimestamp: null
  generation: 1
  labels:
    app: grafana
  name: grafana
spec:
  progressDeadlineSeconds: 600
  replicas: 1
  revisionHistoryLimit: 10
  selector:
    matchLabels:
      app: grafana
  strategy:
    rollingUpdate:
      maxSurge: 25%
      maxUnavailable: 25%
    type: RollingUpdate
  template:
    metadata:
      creationTimestamp: null
      labels:
        app: grafana
    spec:
      containers:
      - envFrom:
        - secretRef:
            name: grafana-creds
        image: docker.io/grafana/grafana:5.3.2
        imagePullPolicy: IfNotPresent
        name: grafana
        resources: {}
        terminationMessagePath: /dev/termination-log
        terminationMessagePolicy: File
      dnsPolicy: ClusterFirst
      restartPolicy: Always
      schedulerName: default-scheduler
      securityContext: {}
      terminationGracePeriodSeconds: 30
Grafana Service
kubectl expose deployment grafana --type=LoadBalancer --port=3000 --target-port=3000 --protocol=TCPExpose on Minikube
minikube service grafana --namespace monitoring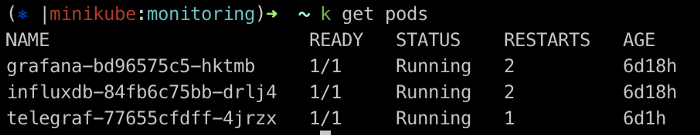
The application can start publishing StatsD events to (192.168.99.100:32161 from outside the cluster), or Telegraf’s service IP using UDP protocol.
You can use target port to access Grafana in your web browser.
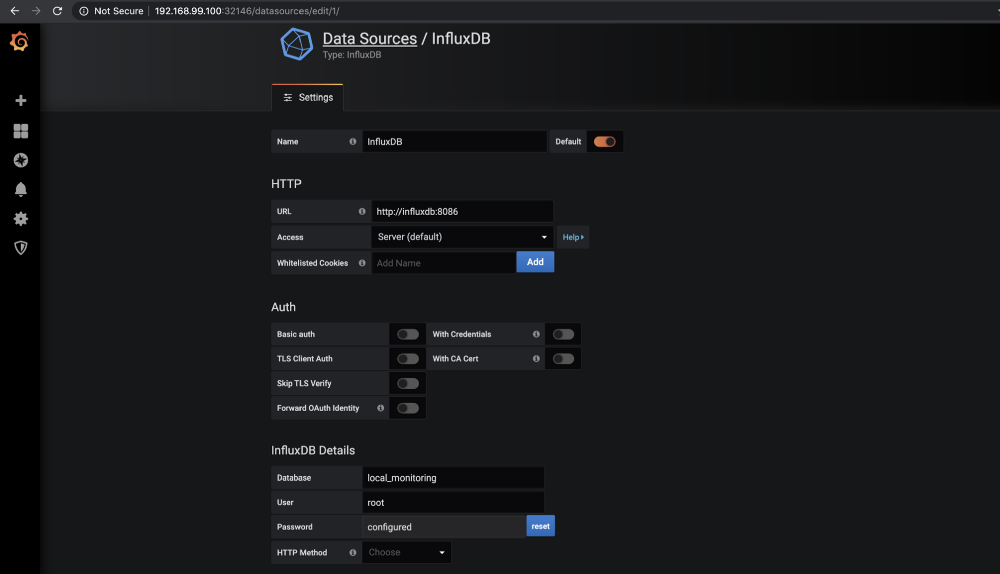
Password is root1234 for InfluxDB (specified in the InfluxDB secret).
A few helpful commands
# Minikube
minikube status
minikube start
minikube stop
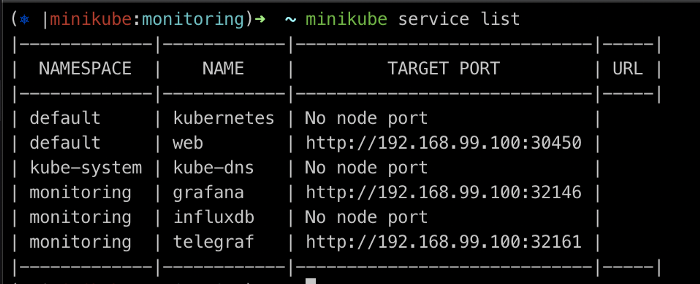
minikube service list
minikube ip
# Kubectl
k get pods -n monitoring # -n namespace
k get pods --all-namespaces
k get svc -n monitoring # -n namespace
k get svc --all-namespacesUseful Links
InfluxDB: https://www.influxdata.com/products/influxdb-overview/
Telegraf: https://github.com/influxdata/telegraf
Grafana: https://grafana.com/grafana/
You can also find the yaml resource definitions here.