[DIY] How to Set Up Prometheus and Ingress on Kubernetes
A simple guide to get started with Prometheus.
![[DIY] How to Set Up Prometheus and Ingress on Kubernetes](/content/images/size/w2000/2020/10/PrometheusDIY.jpg)
By Ankit Deshpande
In the previous post we discussed about the TIG stack and how we can set it up on Kubernetes.
Today let’s take a look at how we can setup Prometheus and use it to monitor Kubernetes cluster and other resources running on the cluster. We will also look in into how to setup NGINX Ingress Controller and monitor it using Prometheus.
Let’s start with some introductions
Prometheus
Prometheus is an open-source systems monitoring and alerting toolkit originally built at SoundCloud.
It records real-time metrics in a time series database built using a HTTP pull model, with flexible queries and real-time alerting. It’s written in Go, and its choice of query language is PromQL.
Prometheus joined the Cloud Native Computing Foundation in 2016 as the second hosted project, after Kubernetes.
Ingress
Ingress allows HTTP and HTTPS traffic from outside the cluster to services within the cluster. Traffic is routed based on the rules defined on the Ingress resource.
An Ingress may be configured to give services externally-reachable URLs, load balance traffic, terminate SSL / TLS, and offer name based virtual hosting.
Ingress can be shared, which means it can be used to route traffic among multiple services running on the cluster, and same AWS/ GCP load balancer can be used. No more creating load balancer per service, This also helps in keeping the AWS / GCP cost down through better resource utilisation.
Note: This is not a production ready configuration/setup, it is for experimenting with how Prometheus, Nginx Ingress work and how to set them up.
Prerequisites
- Access to K8 Cluster / Minikube / MicroK8
- kubectx
- kubens
- alias k=’kubectl’
- helm
- To Set up Grafana and Namespace you can refer to this: https://blog.gojekengineering.com/diy-set-up-telegraf-influxdb-grafana-on-kubernetes-d55e32f8ce48
We will set up the following components:
- Prometheus
- Dashboard on Grafana to monitor K8 Cluster Metrics
- Ingress using Nginx Controller
- Dashboard on Grafana to monitor Nginx Ingress
Set up Prometheus
# Enable metrics server on minikube
minikube addons enable metrics-server
For Prometheus, we will
- Install Prometheus
- Configure a dashboard on Grafana
We can install a lean Prometheus setup using helm charts:
Lets dry-run the helm chart to verify what components it will create (a good practice to follow before deploying any changes to production cluster)
helm install prometheus stable/prometheus --namespace monitoring --dry-runIf no repos are found:helm repo add stable https://kubernetes-charts.storage.googleapis.com/helm repo update
Now to create the resources, lets remove the dry-run flag:
helm install prometheus stable/prometheus --namespace monitoring
The following deployments will be created by the chart:
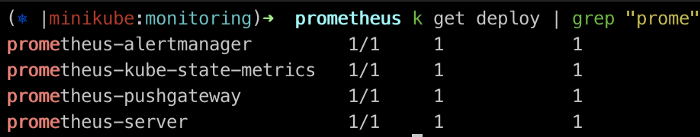
Following DaemonSet will be created by the chart:

To Access Grafana
minikube service list
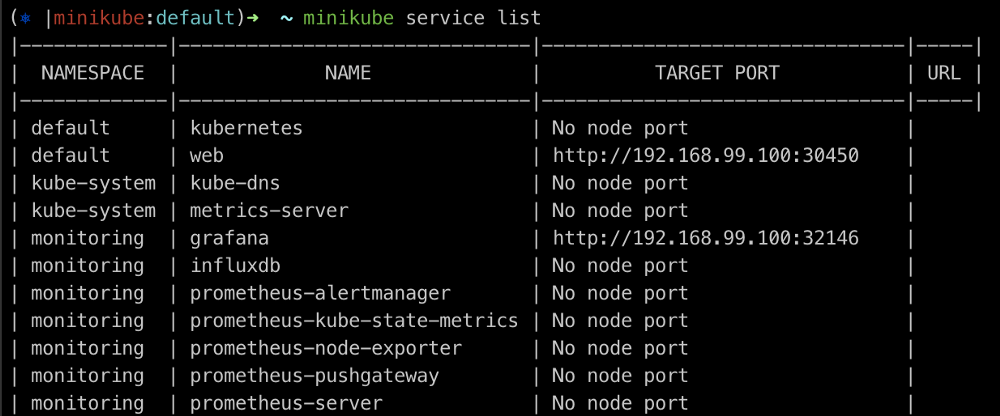
Let’s head to Grafana (http://192.168.99.100:31246) and configure Prometheus as a Data source.
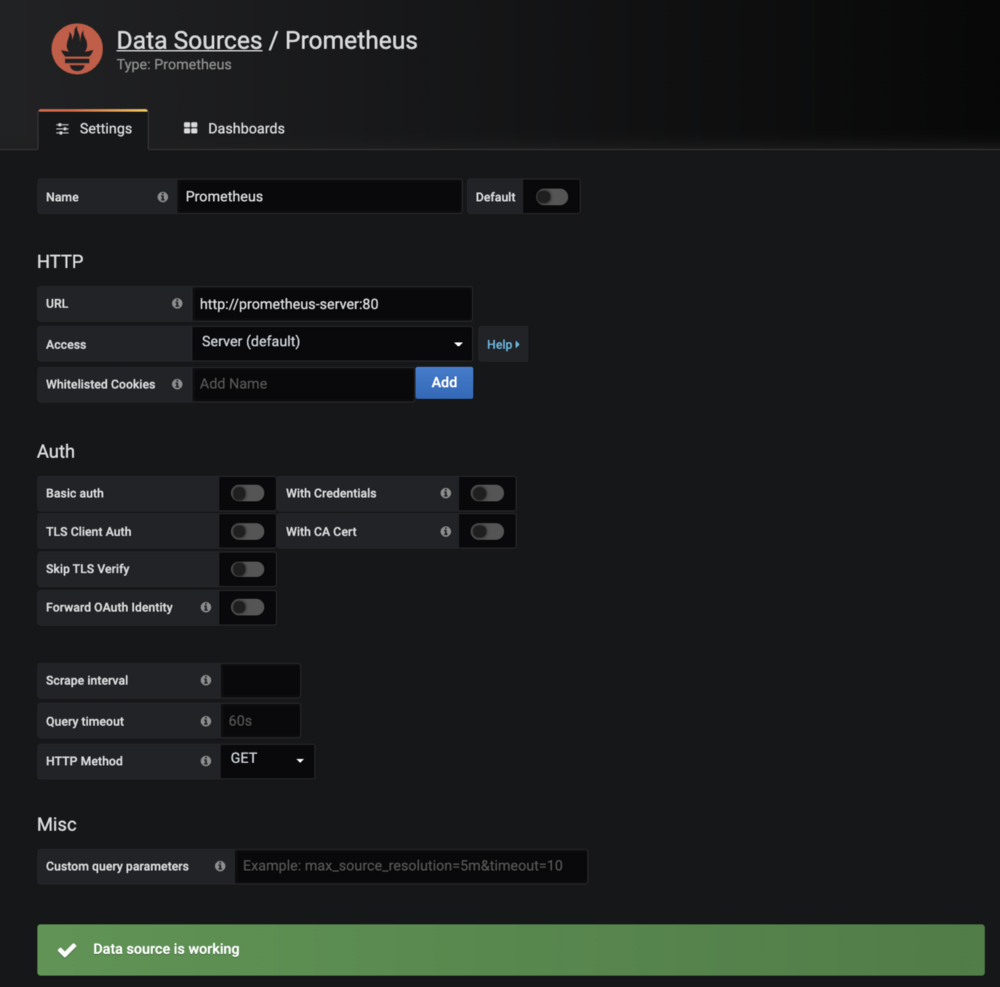
Grafana > Configurations > Add Data sources > Select Prometheus
Configure Prometheus server URL with the kubernetes service endpoint
http://prometheus-server:80
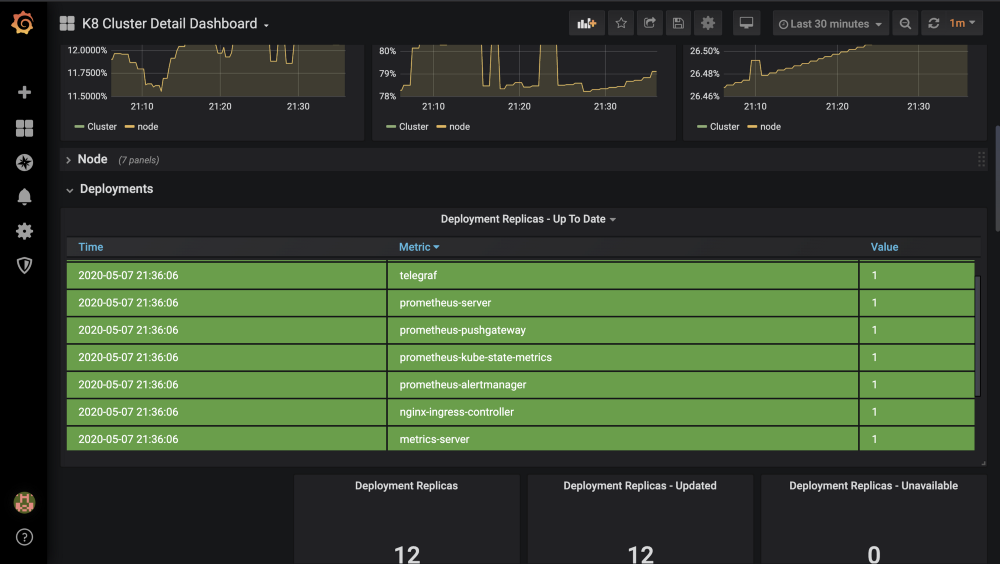
Dashboard for viewing Kubernetes Cluster Metrics
There are a couple of standard dashboards already available on https://grafana.com/grafana/dashboards. Creating customised dashboards on Grafana can be covered in another post.
I have used this one: https://grafana.com/grafana/dashboards/10856, you can choose another one depending on your preference. 😃
To Import Dashboard
- Download JSON (https://grafana.com/grafana/dashboards/10856)
- Open http://grafana_url/dashboard/import
- Upload JSON, configure Prometheus as Data source
Setup Ingress
For Ingress, we will
- Create a sample service/workload
- Install Nginx Controller
- Create Ingress Resource
- Dashboard on Grafana
Create a sample workload
kubectl run web --image=gcr.io/google-samples/hello-app:1.0 --port=8080
kubectl expose deployment web --target-port=8080 --type=NodePort
kubectl get service web
minikube service web
Install Nginx-Controller
On Minikube
:minikube addons enable ingress
On K8 Cluster Using Helm:
helm repo add ingress-nginx https://kubernetes.github.io/ingress-nginx
helm install my-release ingress-nginx/ingress-nginx
Create Ingress Resource
Create ing.yaml with similar resource definition, point it to service we created above:
apiVersion: networking.k8s.io/v1beta1 # for versions before 1.14 use extensions/v1beta1
kind: Ingress
metadata:
  name: web-ingress
  namespace: default
  annotations:
    nginx.ingress.kubernetes.io/rewrite-target: /$1
spec:
  rules:
  - host: hello-world.info
    http:
      paths:
      - path: /
        backend:
          serviceName: web
          servicePort: 8080
Run the command to create Ingress resource:
k create -f ing.yaml
To access our sample workload using Ingress:
curl 192.168.99.100 -H 'host: hello-world.info'
or
create entry in etc.hosts for hello-world.info to point to Ingress's IP.
To Create Dashboard
- Download JSON (https://github.com/kubernetes/ingress-nginx/blob/master/deploy/grafana/dashboards/nginx.json)
- Open http://grafana_url/dashboard/import
- Upload JSON, configure Prometheus as a Data source.
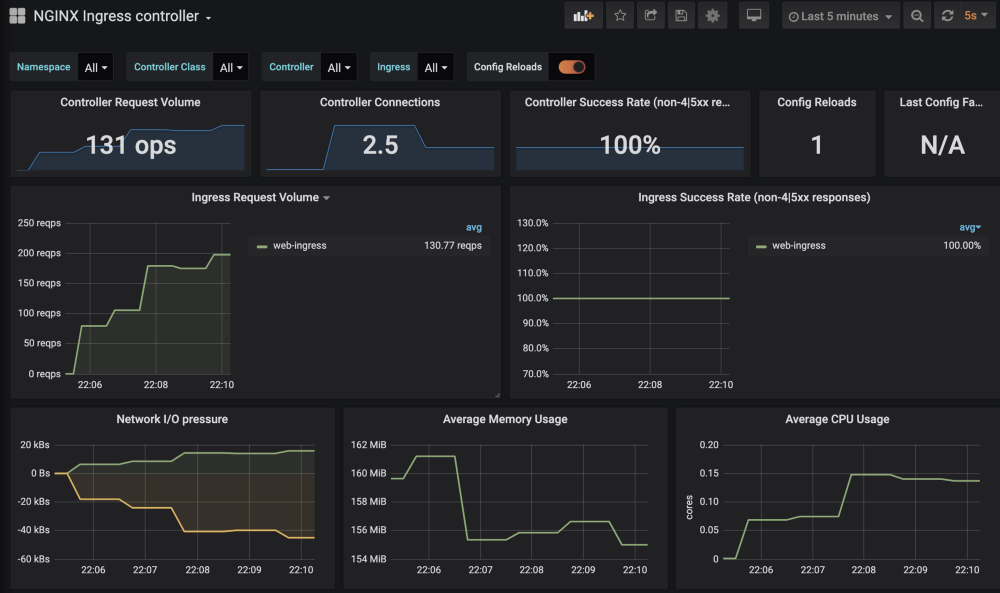
After you have configured the dashboard, we can generate some sample load by making some requests using CURL
while true; do
 curl -X GET 192.168.99.100 -H 'host: hello-world.info'
done
We can see metrics being reported on the dashboard:
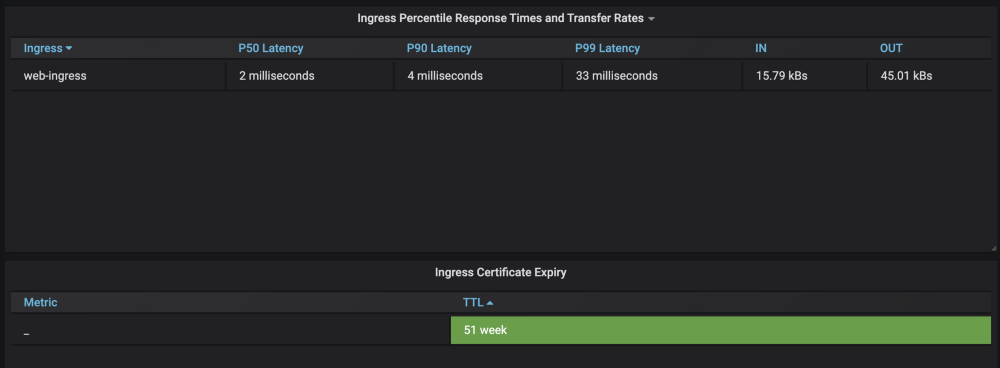
Wait, what, how did it start reporting metrics ?
We didn’t configure any targets for Prometheus to scrape/pull the metrics from, so how did it start working ?
Let’s describe NGINX Pod
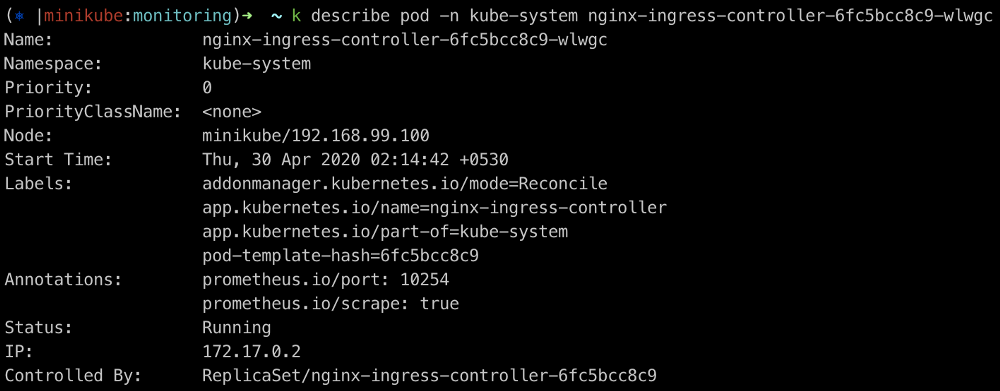
Annotations: prometheus.io/port: 10254
             prometheus.io/scrape: true
If we hit, http://172.17.0.2:10254/metrics on the K8 Cluster, it returns a list of metrics which the monitoring module on NGINX has captured:
# TYPE nginx_ingress_controller_bytes_sent histogram
nginx_ingress_controller_bytes_sent_bucket{controller_class="nginx",controller_namespace="kube-system",controller_pod="nginx-ingress-controller-6fc5bcc8c9-wlwgc",host="hello-world.info",ingress="web-ingress",method="GET",namespace="default",path="/",service="web",status="200",le="1000"} 57418
# HELP nginx_ingress_controller_config_hash Running configuration hash actually running
# TYPE nginx_ingress_controller_config_hash gauge
nginx_ingress_controller_config_hash{controller_class="nginx",controller_namespace="kube-system",controller_pod="nginx-ingress-controller-6fc5bcc8c9-wlwgc"} 1.2267467118072482e+19
# HELP nginx_ingress_controller_config_last_reload_successful Whether the last configuration reload attempt was successful
# TYPE nginx_ingress_controller_config_last_reload_successful gauge
nginx_ingress_controller_config_last_reload_successful{controller_class="nginx",controller_namespace="kube-system",controller_pod="nginx-ingress-controller-6fc5bcc8c9-wlwgc"} 1
# HELP nginx_ingress_controller_config_last_reload_successful_timestamp_seconds Timestamp of the last successful configuration reload.
# TYPE nginx_ingress_controller_config_last_reload_successful_timestamp_seconds gauge
nginx_ingress_controller_config_last_reload_successful_timestamp_seconds{controller_class="nginx",controller_namespace="kube-system",controller_pod="nginx-ingress-controller-6fc5bcc8c9-wlwgc"} 1.588872624e+09
# HELP nginx_ingress_controller_ingress_upstream_latency_seconds Upstream service latency per Ingress
# TYPE nginx_ingress_controller_ingress_upstream_latency_seconds summary
nginx_ingress_controller_ingress_upstream_latency_seconds_sum{controller_class="nginx",controller_namespace="kube-system",controller_pod="nginx-ingress-controller-6fc5bcc8c9-wlwgc",ingress="web-ingress",namespace="default",service="web"} 0.5930000000000002
# TYPE promhttp_metric_handler_requests_total counter
promhttp_metric_handler_requests_total{code="200"} 2936
promhttp_metric_handler_requests_total{code="500"} 0
promhttp_metric_handler_requests_total{code="503"} 0
.
.
.
# more metrics
Now, let’s look at Prometheus and try to figure out how it is pulling these metrics from the NGINX Pods.
To Access Prometheus Dashboard
# Since, we haven’t exposed Prometheus service outside the K8 Cluster, lets use Port forwarding
export POD_NAME=$(kubectl get pods --namespace monitoring -l "app=prometheus,component=server" -o jsonpath="{.items[0].metadata.name}")

# Access Prometheus Dashboard on http://localhost:9090
kubectl --namespace monitoring port-forward $POD_NAME 9090
Prometheus Targets
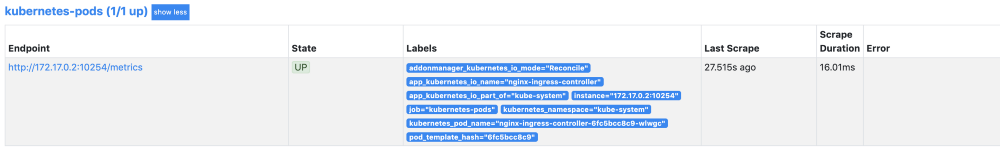
Let check http://localhost:9090/targets, this will list down all the targets that Prometheus will scrape metrics from. Targets can be configured statically using static_configs or dynamically using one of the supported service-discovery mechanisms.
Let’s look at the NGINX Target:
Prometheus Service Discovery
Check out NGINX Service Discovery
http://localhost:9090/service-discovery
NGINX Pod Discovered
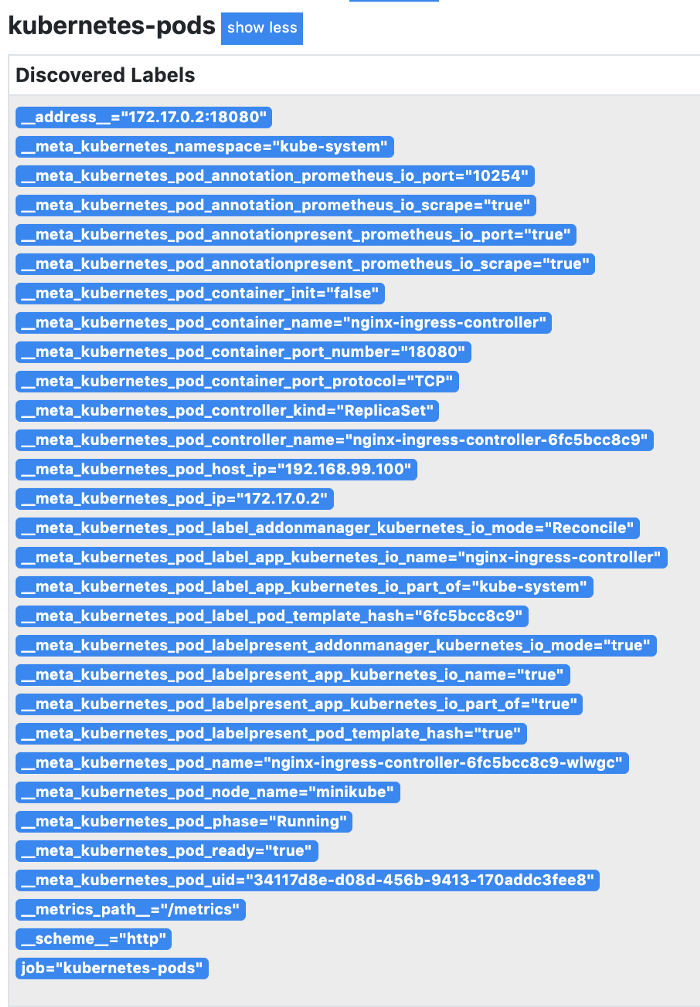
There are a couple of other discovered pods as well, for now we are only interested in NGINX Pods.
Conclusion
This is just a setup guide to begin playing around with NGINX Ingress and Prometheus.
Prometheus also has a lot of other components:
- Prometheus Server
- Alert Manager
- Push Gateway
- Exporters
Prometheus can be used for a lot of other things. It can scrape custom application metrics as well, all the application has to do is to implement a /metrics or a similar endpoint and expose metrics that are to be monitored.
Using PromQL, it can create alerts based on thresholds for metrics.
Using AlertManager, it can decide which channels/integrations to deliver alerts to.
We will take a look at Prometheus in depth some other time.
A few helpful commands
# Minikube
minikube status
minikube start
minikube stop
minikube service list
minikube ip

# Kubectl
k get pods -n monitoring # -n namespace
k get pods -A
k get svc -n monitoring # -n namespace
k get svc -A

export POD_NAME=$(kubectl get pods --namespace monitoring -l "app=prometheus,component=server" -o jsonpath="{.items[0].metadata.name}")
kubectl --namespace monitoring port-forward $POD_NAME 9090
Useful Links
Prometheus: https://prometheus.io/
Prometheus Configuration: https://prometheus.io/docs/prometheus/latest/configuration/configuration/
Grafana: https://grafana.com/grafana/
Ingress: https://kubernetes.io/docs/concepts/services-networking/ingress/
Deploy Nginx Controller: https://kubernetes.github.io/ingress-nginx/deploy/
Node Exporter: https://github.com/prometheus/node_exporter
Cortex Project: Horizontally scalable, highly available, multi-tenant, long term Prometheus.
https://github.com/cortexproject/cortex
https://cortexmetrics.io/
You can also find the yaml resource definitions here.
That’s all from me for now. Hope you found this post useful!
