Deep Diving Memory Leak In A Clojure Application
Here's a case study of how we identified a memory leak issue in a Clojure application and how we resolved it.

By Vibhu Garg
Before we delve into a real memory leak issue in a Clojure application, let’s understand the application at a high level and its impact.
The problem at hand
We maintain domain constants as a proto schema in a central domain-entities repository. Different services access these domain constants depending on the respective business use-cases. Many services use these domain constants, which makes adding and propagating a new domain constant a very long, tedious, and error-prone task. To get the new domain constants added, a PR needs to be raised in each service to upgrade the latest version of the domain constants and also needs cross-collaboration between different engineering & product teams.
The solution: Dynamic Protobuf Descriptor Library.
This library was essentially designed to fetch the changes in the domain constants proto in run-time & run the services on the latest protobuf schema. Below were the main focus areas of this library:
- Services will dynamically become aware of new values that get added to the domain constants proto file.
- This can replace the hard-coded list of domain constants maintained by different services.
- Re-deployment of service won’t be required as version upgrade of domain constants won’t be required, each time addition or update is done to the domain constants.
Dynamic Protocol Buffer Schema
Google Protobuf team offers this concept called descriptor sets, which helps with exchanging a schema like any other binary proto message.
Message’s descriptor can be used to learn at runtime what fields it contains and what the types of those fields are.
Using Dynamic message along with descriptors for a particular protocol buffer, transformation can be done for both consuming a Kafka message and producing the Kafka message.
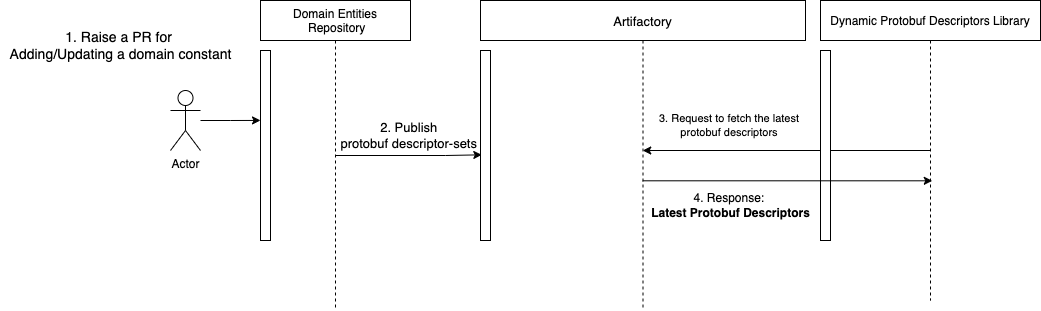
Sequence Diagram
This sequence diagram helps to understand how this library can make the launch of new domain constants, updates to existing domain constants, a very seamless & time-saving process.
Impact
- Adding domain constants is now a very seamless & time-saving process. Every complexity is abstracted out in the form of the Dynamic Protobuf Descriptor Library.
- Removed the need for collaboration between different engineering teams, business teams, PR merge, upgrade of version of the domain constants extensive testing, etc.
debug resolve a memory-leak Dynamic Protobuf Descriptors Library
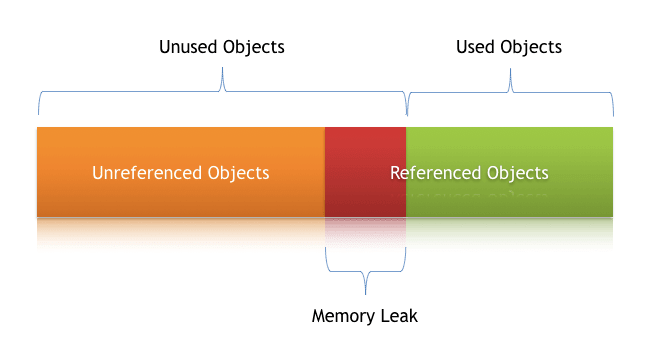
What is a Memory leak in JVM-based languages?
A memory leak is a scenario that occurs when objects are no longer being used by the application, but the Garbage Collector is unable to remove them from working memory — because they’re still being referenced. As a result, the application consumes more and more resources — which eventually leads to a fatal OutOfMemoryError.
Origin of Memory-Leak in Dynamic Protobuf Descriptors Library
For serialization & deserialization of Clojure objects, we used an open-source library, named clojusc/protobuf.
How did the issue surface?
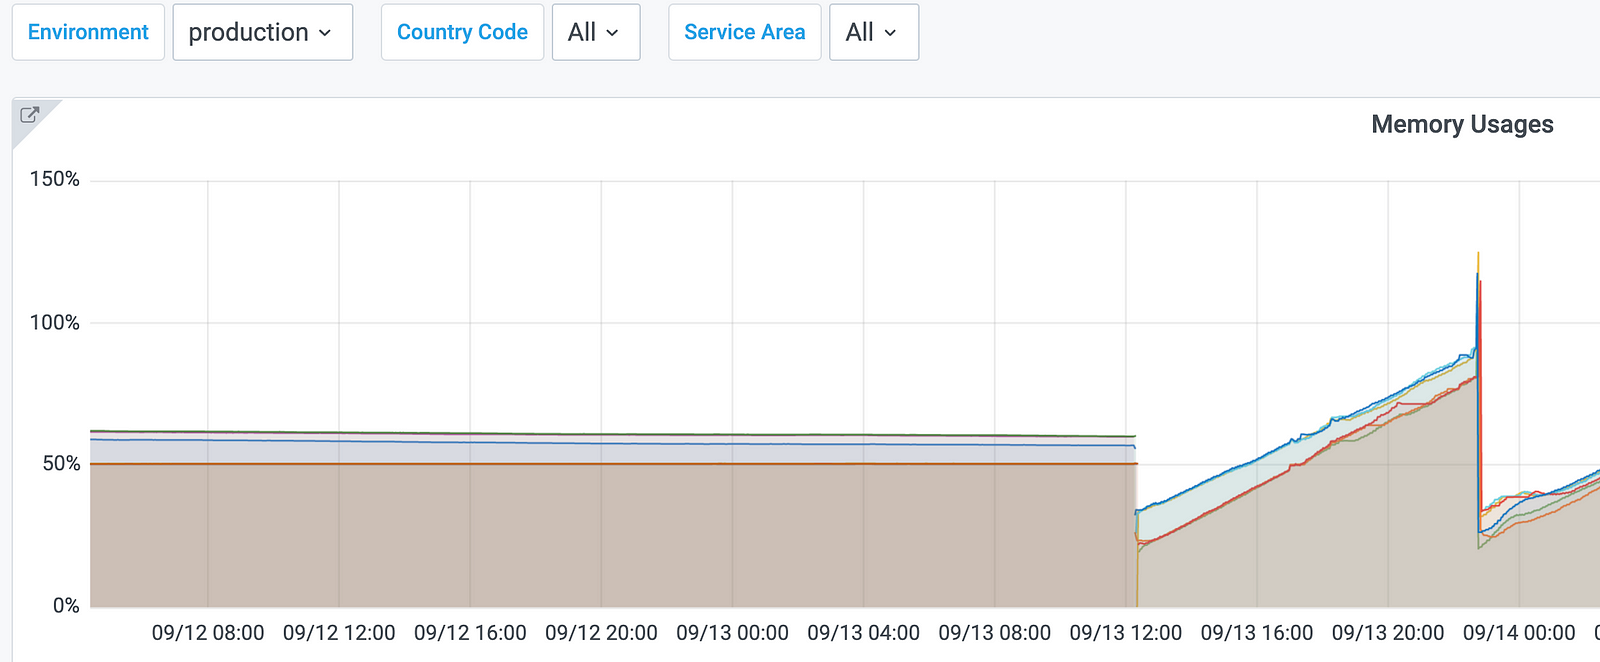
This library was integrated by one of our services. They had a grafana dashboard setup on memory usage. After the integration of this library, memory usage kept on increasing which also led to frequent restarts of the pods.
We took the heap dump on the server where this service was running using the jmap command.
jmap -dump:live,format=b,file=/tmp/proto_dll_memory_leak.hprof 12587
//Note: 12587 is the pid of a process.
Below is a little explanation for the jmap command parameters-
live: It’s an optional parameter and if set, it only prints objects which have active references and discards the ones that are ready to be garbage collected.
format=b: It specifies that the dump file will be in binary format.
file=/tmp/proto_dll_memory_leak.hprof: The file where the dump will be written to. You may give any name.
pid: The id of the Java process.
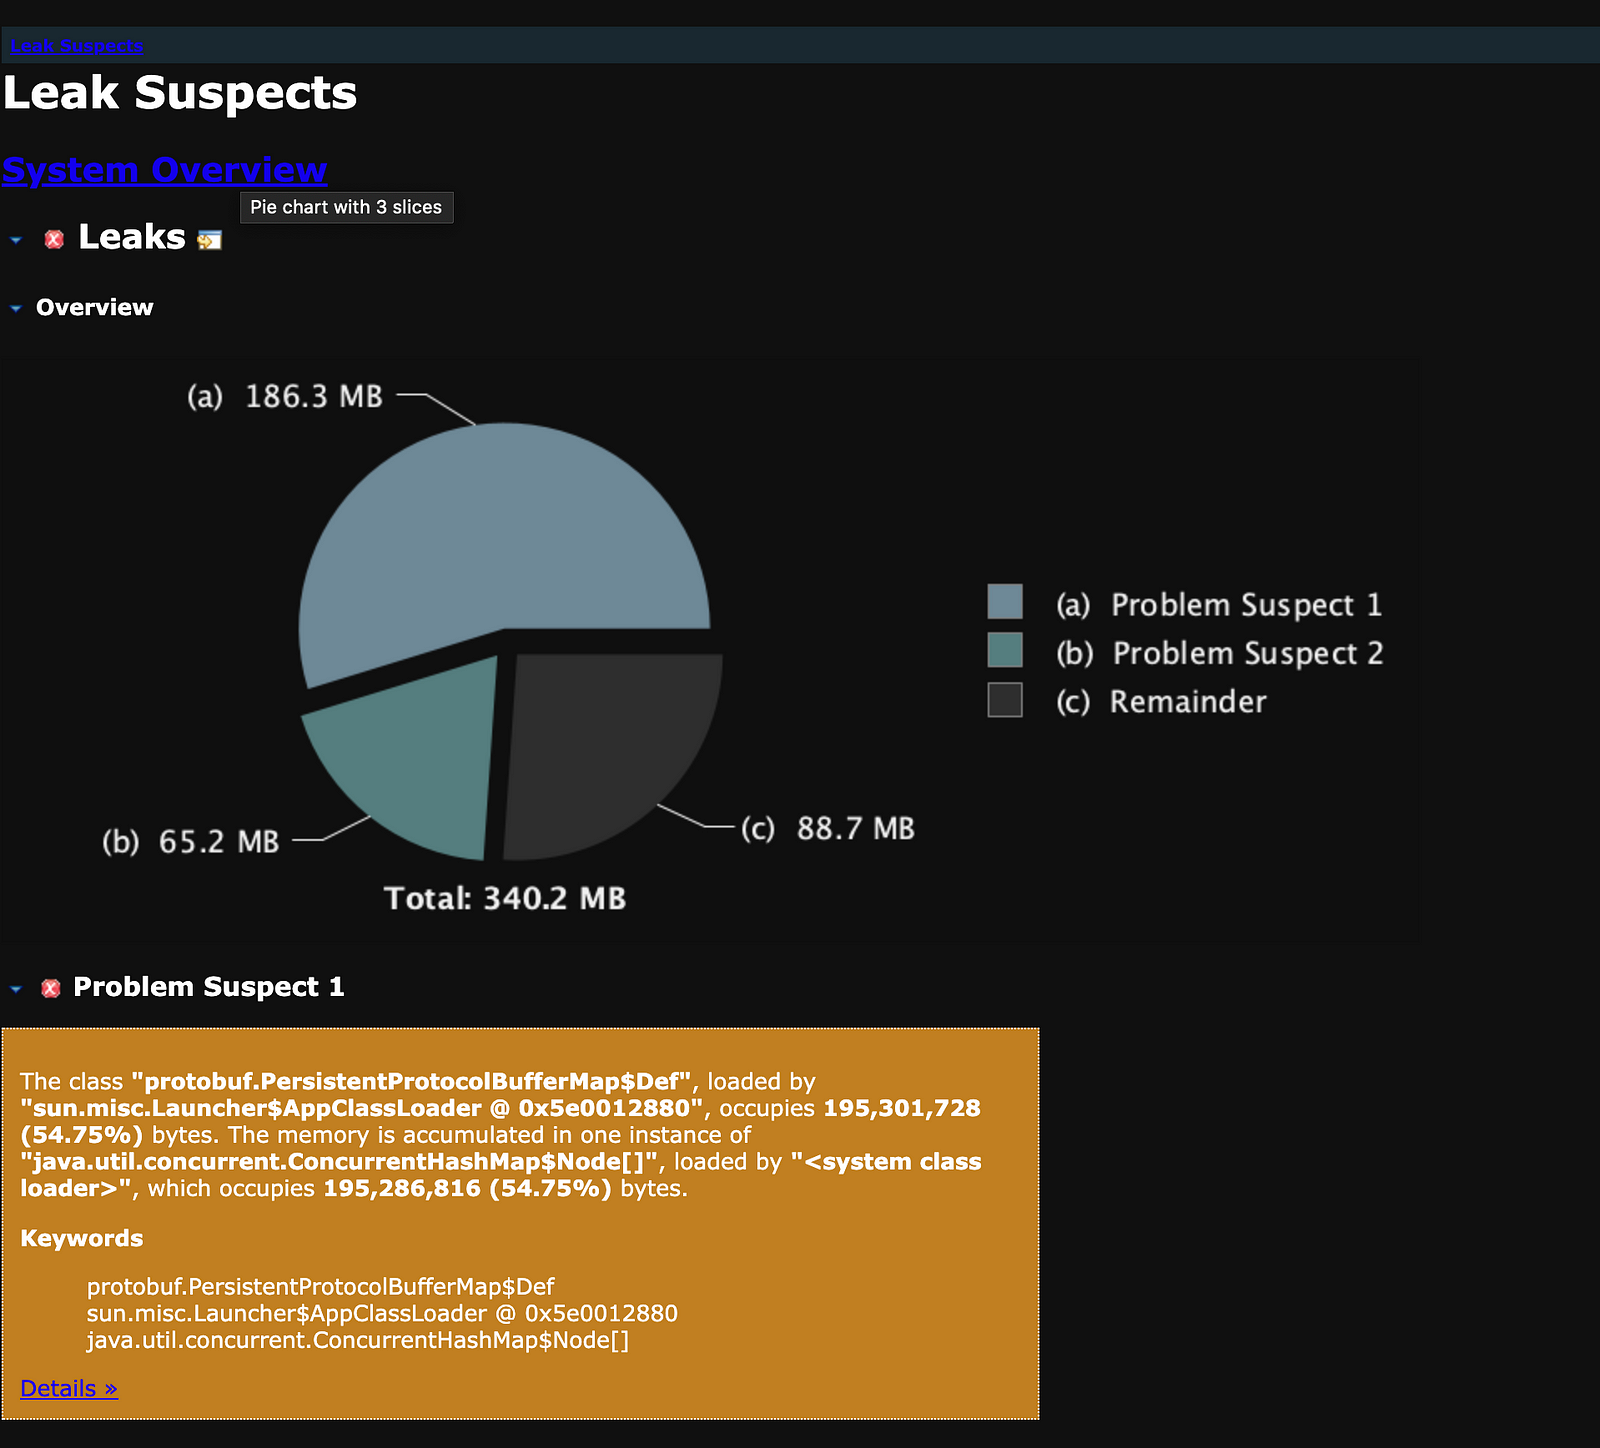
Once, you get the heap dump, you can analyze the same in Eclipse Memory Analyzer Tool.
Below are the results using MAT-
Observations:
- After analysis of the heap dump using Eclipse MAT, it was found that
protobuf.PersistentProtocolBufferMap$Defis causing memory leak which is referenced by a variable calleddefCache. - This library does not cache any schema definitions or
protobuf.Descriptordefinitions, the library is dependent onstencil-clientto cache theprotobuf.Descriptors. - With
protobuf.PersistentProtocolBufferMap$Defbeing a type exposed byclojusc/protobufthe library this narrows the problem to the dependency library. - We further deep-dive the open-source
clojusc/protobuflibrary and tried to understand it at the code level. We found that theclojusc/protobuflibrary caches the initialized schema definitions at the following location using aConcurrentHashMapwhich is aligned with the heap-dump report.
Root-Cause: The library clojusc/protobuf contains a method mapdef which internally calls a method convertUnderscores to convert - to _. This method implements an in-memory cache to hold the descriptors & their child elements against the naming strategy so that this conversion does not happen again and can be served from the cache itself. But, each time the convertUnderscores method is called, it treats descriptors as a new key and adds it to the cache, eventually leading to memory overflow.
Learnings
->schemaa function is designed to be called against compiled Java protocol buffer classes instead of protobuf descriptor sets.- Reading the documentation in detail is very important to not run into such issues in the future.
Solution
Due to our unique use case to deal with Google protobuf descriptor sets, we implemented our custom serialization & deserialization functions to provide the required functionality to convert Clojure map to byte-array & vice-versa.
Conclusion
The main objective of this article was to draw attention to the problem of memory leaks in our day-to-day applications. This article cites a real case study of how we identified a memory leak issue in a Clojure application and how we resolved it.
Special thanks to Hari krishna and shanmuganandh for working with me on this.
Review credits: svethacvl, shanmuganandh.

Click here to read more stories from the vault.
To view open job positions, click below: