Building A Tool To Improve Go Codebase's Test Coverage
Taking the test coverage from 55% to 85% - here's how we built Go-coverage.

By Prathik Rajendran M
If you’ve been in the tech landscape, you’d agree a test coverage of 70–80% is a reasonable goal to have. But we had a service that used to have 55% test coverage. And it needed serious changes.
It all rolls back to this one issue where a bug went into production because unit tests were not written for a feature. These tests were not written because it needed an entire end-to-end setup to test that section of code. So, we took up the initiative to improve the test coverage of this codebase. Since the existing Go tooling didn’t allow us to filter out parts of code which was largely untested, we had to go one file at a time based on those with <50% coverage and inside that, find functions with low coverage. In case the file itself was of 10–15 LOC and had 2–3 untested functions, we’d skip it since there would be 100–500 LOC files/functions that had similar percentage of coverage.
In order to solve this problem, we wrote the Go coverage plugin. Using this tooling and by focusing on writing tests, we were able to get the coverage of our codebase to >85% which is the sweet spot when it comes to ROI on code coverage. This blog will detail every step we took to build it.
Is coverage a good indicator of code quality?
High (>80%) coverage might mean the codebase itself is high quality, low (<50%) coverage definitely means the codebase is of low quality. The reason being, one can always write assertion free/bad tests which will boost the overall code coverage metric, but still not be confident to make changes.
Tests are all about driving confidence to make changes.
If you have a software that would never change, then manual testing is enough. Automated tests come to picture when you have to constantly make changes and when they are done, you need to know that your code works. Repeatedly doing manual testing in a place which needs frequent change would add 10–15x more time over the automation suite running.
High coverage is a leading indicator of all the paths in the code being tested. Hence, it’s an indicator to say that in case there’s any change to the codebase which doesn’t conform to the user expectations then the tests will fail. However, there is a big precondition that the tests themselves are written well. This is where Goodhart’s law comes into play. If coverage itself becomes a target and there is pressure to achieve it, people tend to forget the core reason why test coverage needs to be high or indicated in the first place.
Considering the above points whether coverage is a good indicator of code quality depends on how well the tests are written. If tests are written well and test for the behaviours expected by the users then we should aim to achieve a high coverage.
Issues with code coverage as an indicator of quality
One of the key issues with having code coverage as a key metric is that it becomes a vanity metric. 98% code coverage is not something customers care about. Customers want the software to work as expected. In the journey to get 100% code coverage, we miss the core tradeoff: the effort spent in writing tests vs the value delivered to customers. After a threshold, the effort it takes to write tests delivers less value compared to the effort put in delivering features to customers.
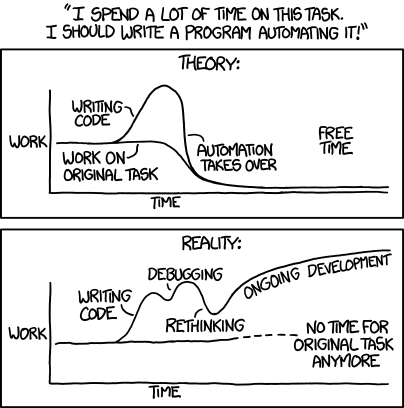
The comic provides a great illustration on the point made above.
The effort being put in automating tests should not take over delivering value to users.
In the same lines of it being a vanity metric, attempts to increase code coverage also leads to writing assertion free tests. These tests cover the code paths but do not do assertions on the core business logic expected. An example: Suppose a function returns a list of entities, if the assert is only on the count of the entities and not what values are returned in the entities, you will miss the bugs in entity construction itself. However, the function will have good code coverage.
Issues with the current Go tooling
Given that we had clarity over what types of tests are useful and what are not, we set out to improve the maintainability and testability of our code base. There were parts of the code base that were hard to test because it needed two external processes to be up and running for it, one was a service owned by another team and the other was a database. This would lead to at least 5 seconds of setup time itself thus breaking a key rule of thumb with tests (also called F.I.R.S.T principle) that it has to execute within 100 ms. The Java ecosystem has Mockito which can be used to mock out these dependencies, there is something similar in Go ecosystem called go-mock which helped us with this problem.
The problem that bothered us was how we prioritise what to test. The existing test tooling in Go provides a way to see coverage, however, it only shows the percentages. This meant that we had to go file by file to determine if it has low coverage percentage because it has many LOC untouched or whether it’s a util file of 10–20 lines where some non-critical branches were left uncovered. This is fine for a codebase of 10–15 files but can be a real pain when dealing with codebases with more than 100 files.
Building go-coverage
Go-coverage is a utility we built to alleviate the problems mentioned above. You need to pass the coverage profile of your codebase and it will generate a report with what section of codebase if covered would give what percentage of improvement in code coverage. This comes with two key features as well:
- To remove functions of less than some size from the report
- To ignore certain files
Usage
To use go-coverage you need to generate the coverage report first. This is done by running:
go test ./… -coverprofile=coverage.out
Then pass this coverage profile to go-coverage
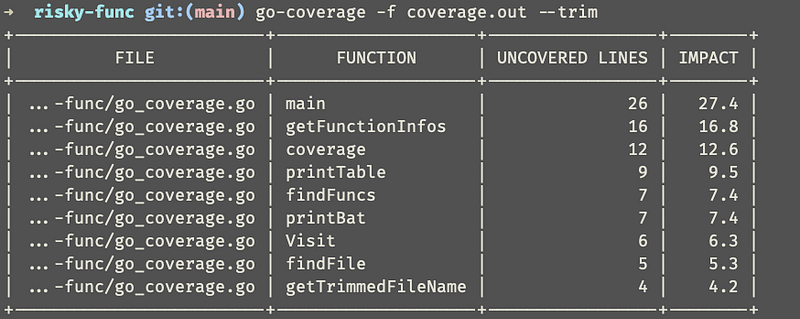
go-coverage -f coverage.out — line-filter 10
Line Filter
We observed that on a codebase with greater than 50 files there are a lot of small functions that create noise while doing an initial analysis of what to test. To remove such noise you can run go-coverage in the following way:
go-coverage -f coverage.out — line-filter 10
This will ensure that all functions that have less than 10 uncovered lines are removed from the report.
By passing the — line-filter 10 you tell go-coverage to remove from report all the functions that have a size of less than 10 lines. Another observation we made is that there could be a file or a function with high impact. But, the benefit of testing that to the time it would take to do the same has negative returns. For this we have a regexp based exclusion filter — exclude “.*config.*”.
Trim File Names
By default go-coverage prints the full file path but this might not be necessary. You can use the command below to trim the file names.
go-coverage -f coverage.out — line-filter 10 — trim
Social data to prioritise what to test
Using only go-coverage isn’t always enough to navigate to which section of the code needs most attention in terms of the tests. One key thing to note is that you need >85 % coverage in places that are most prone to changes. This is because the parts that don’t change are assumed to be stable and working. One way to understand what places see the most changes you can use the data from git. You can run the command below to identify the files that change the most and use this to inform what tests to prioritise first
git log — pretty=format: — name-only | sort | uniq -c | sort -rg | head -10
Tests are essential to maintainability. However, not all code bases have it. Use the tools and techniques mentioned above to ensure better test coverage focused in the right areas, thereby allowing improved maintainability and faster changes to your codebase.

Find more stories from our vault, here.
Also, we’re hiring! Check out open job positions by clicking below: